Consolidated dashboards that surface operational performance, financial outcomes, and optimization impact in real time.
CAIRE provides five integrated analytics modules to give you complete visibility into your operations
Executive dashboard showing high-level KPIs and trends across all areas. Time period selectors (7/30/90 days), key performance indicators with trend arrows, and quick access to detailed sections.
Detailed analysis of schedule optimization performance. Track continuity scores, recaptured hours, assignment rates, and before/after optimization comparisons with performance badges.
Tab-based analysis of employees, clients, service areas, and visits. Sortable tables, utilization metrics, hierarchical service area performance, and drill-down capabilities.
Revenue tracking in SEK, cost analysis, margin calculations, and ROI metrics from AI optimization. Interactive charts with Swedish currency formatting throughout.
Service delivery efficiency and quality metrics. Travel time optimization, constraint satisfaction rates, unused hours recapture, and efficiency benchmarks.
Track what matters most for your home care organization
All metrics are calculated from actual optimization results and organizational data. No mock data – only real insights that drive decision-making and demonstrate tangible ROI.
Total revenue, staff costs, margin percentages, and profitability trends. All displayed in SEK with Swedish locale formatting.
Percentage of productive time vs total working time. Track efficiency improvements from 65% to 70%+ through AI optimization.
Percentage of visits successfully assigned to employees. Monitor unassigned visits and optimize resource allocation.
Total travel time vs service time breakdown. Track 15-20% reductions in travel time through route optimization.
Number of different caregivers per client per month. Lower numbers indicate better continuity and care quality.
Previously unused time slots converted to billable hours. Track potential revenue from optimized time utilization.
Comprehensive insights into your most valuable assets: people, clients, and service areas
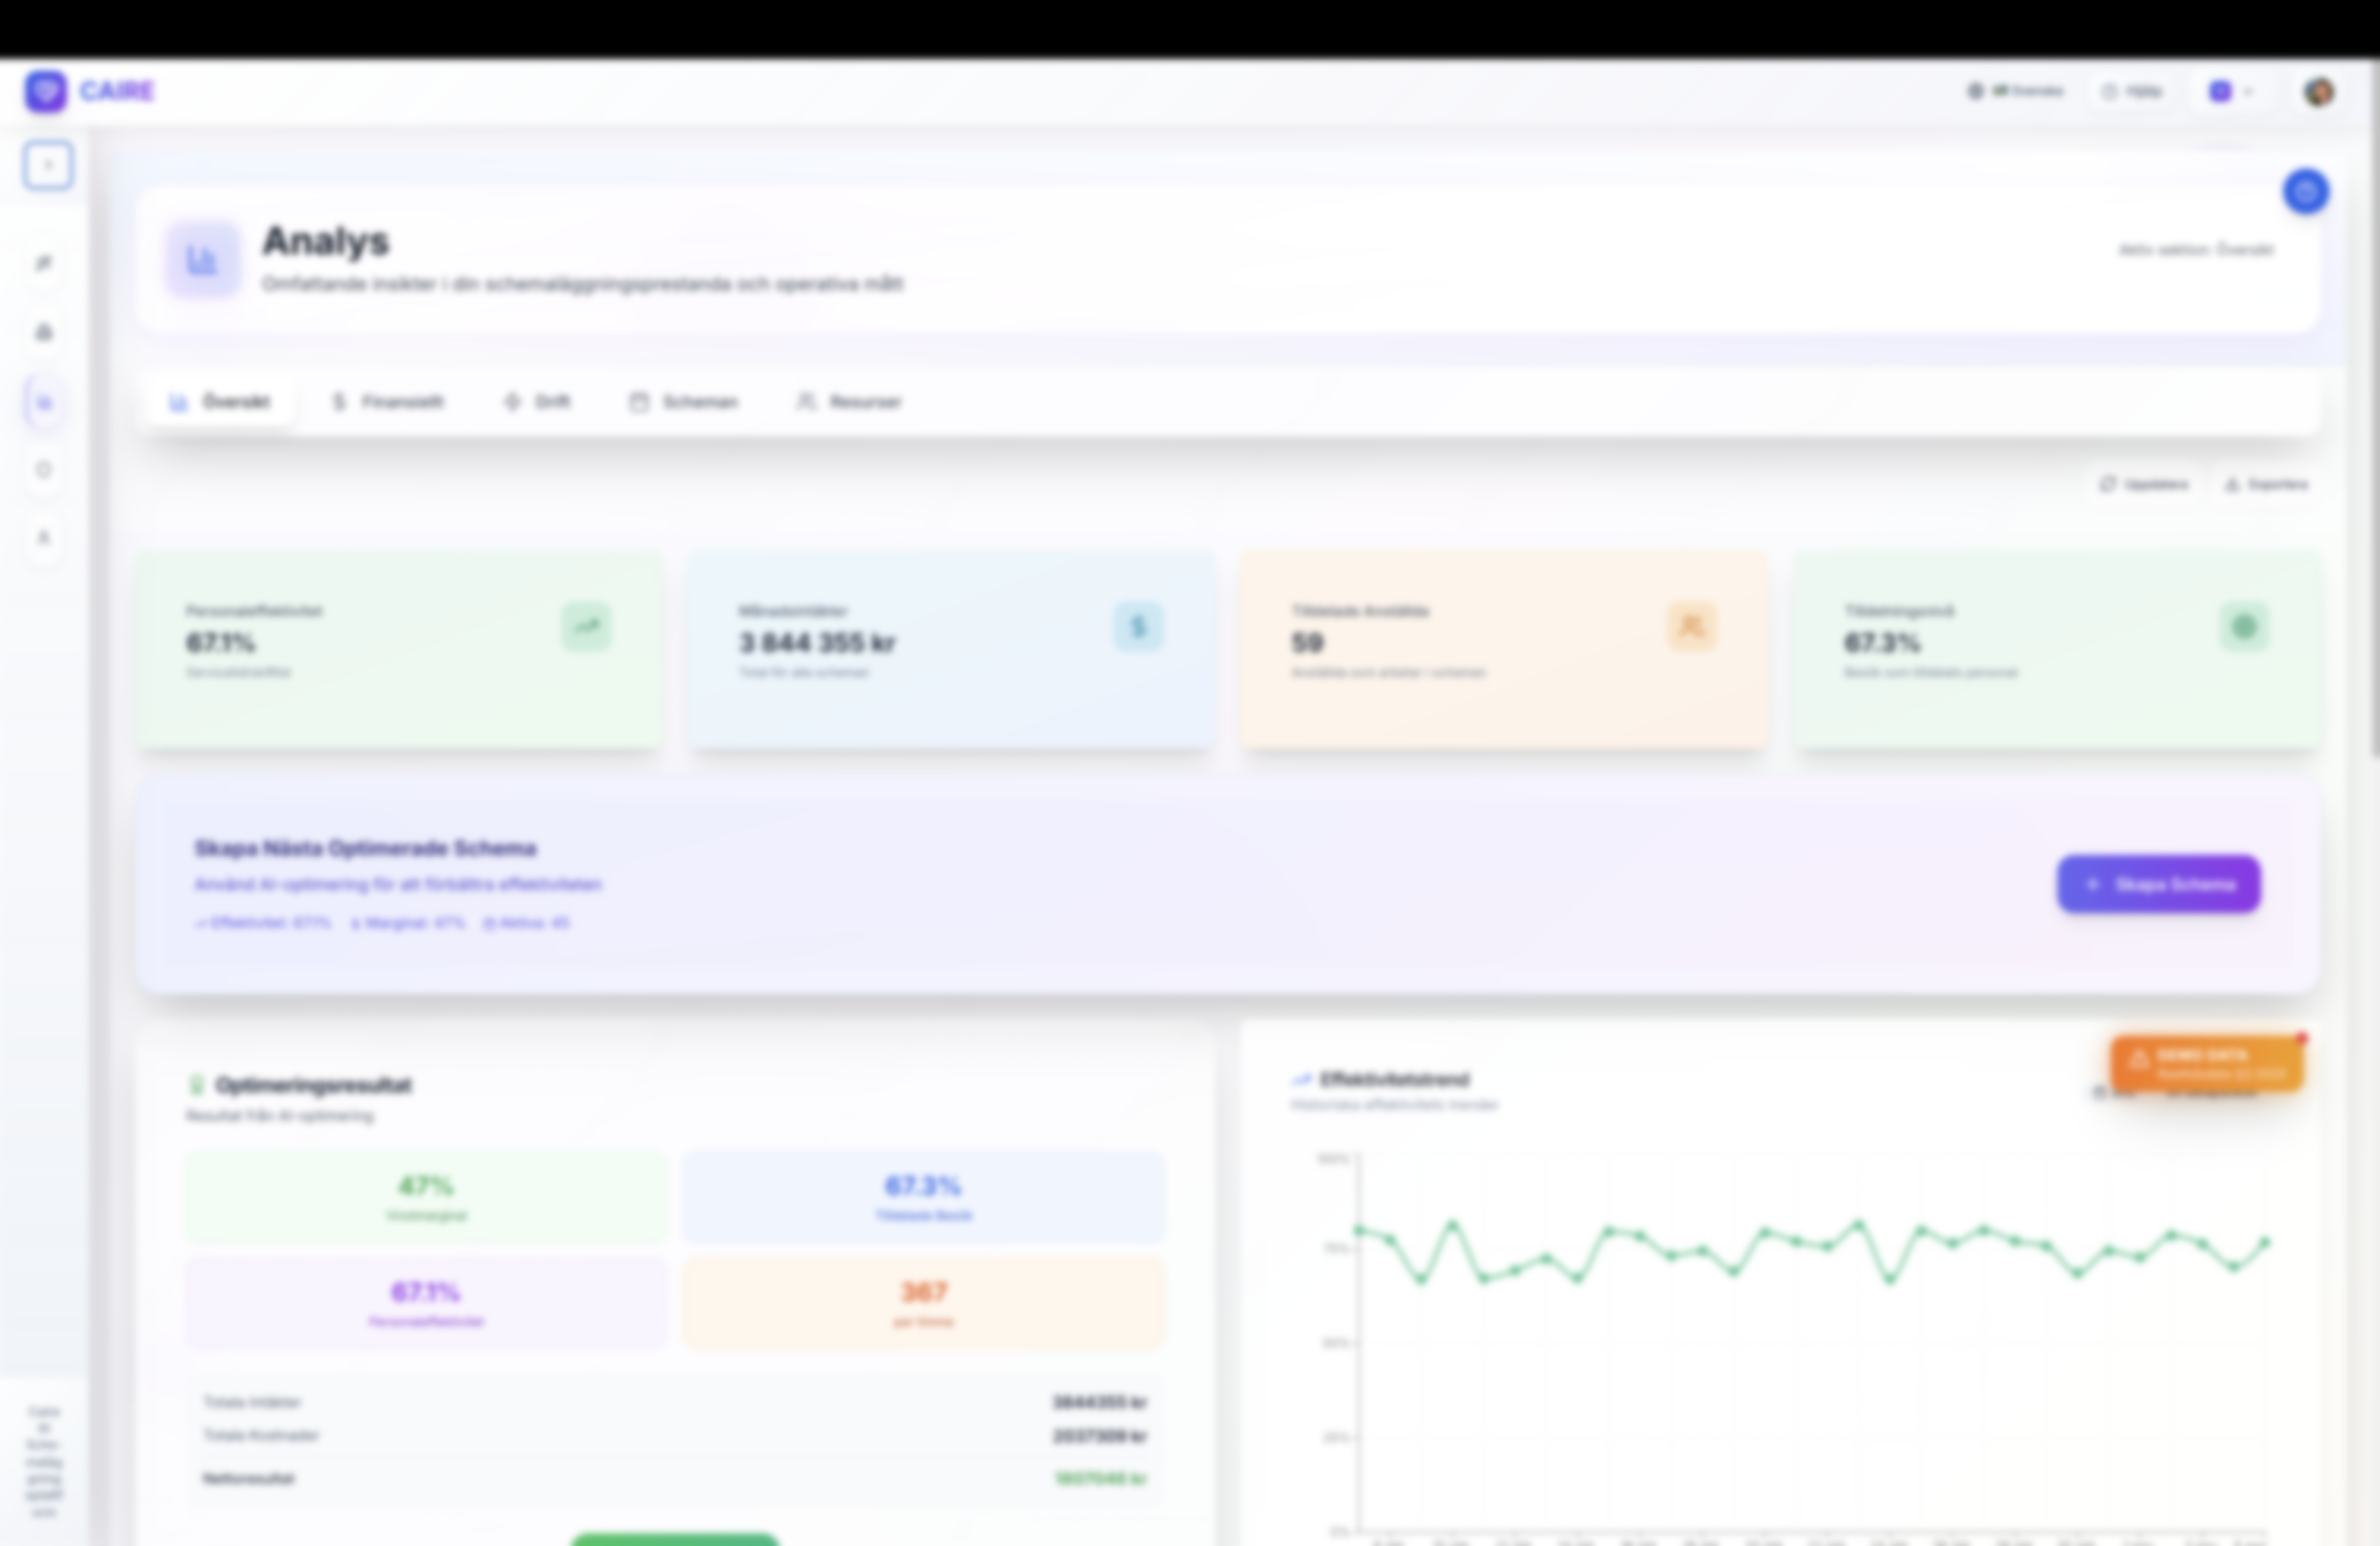
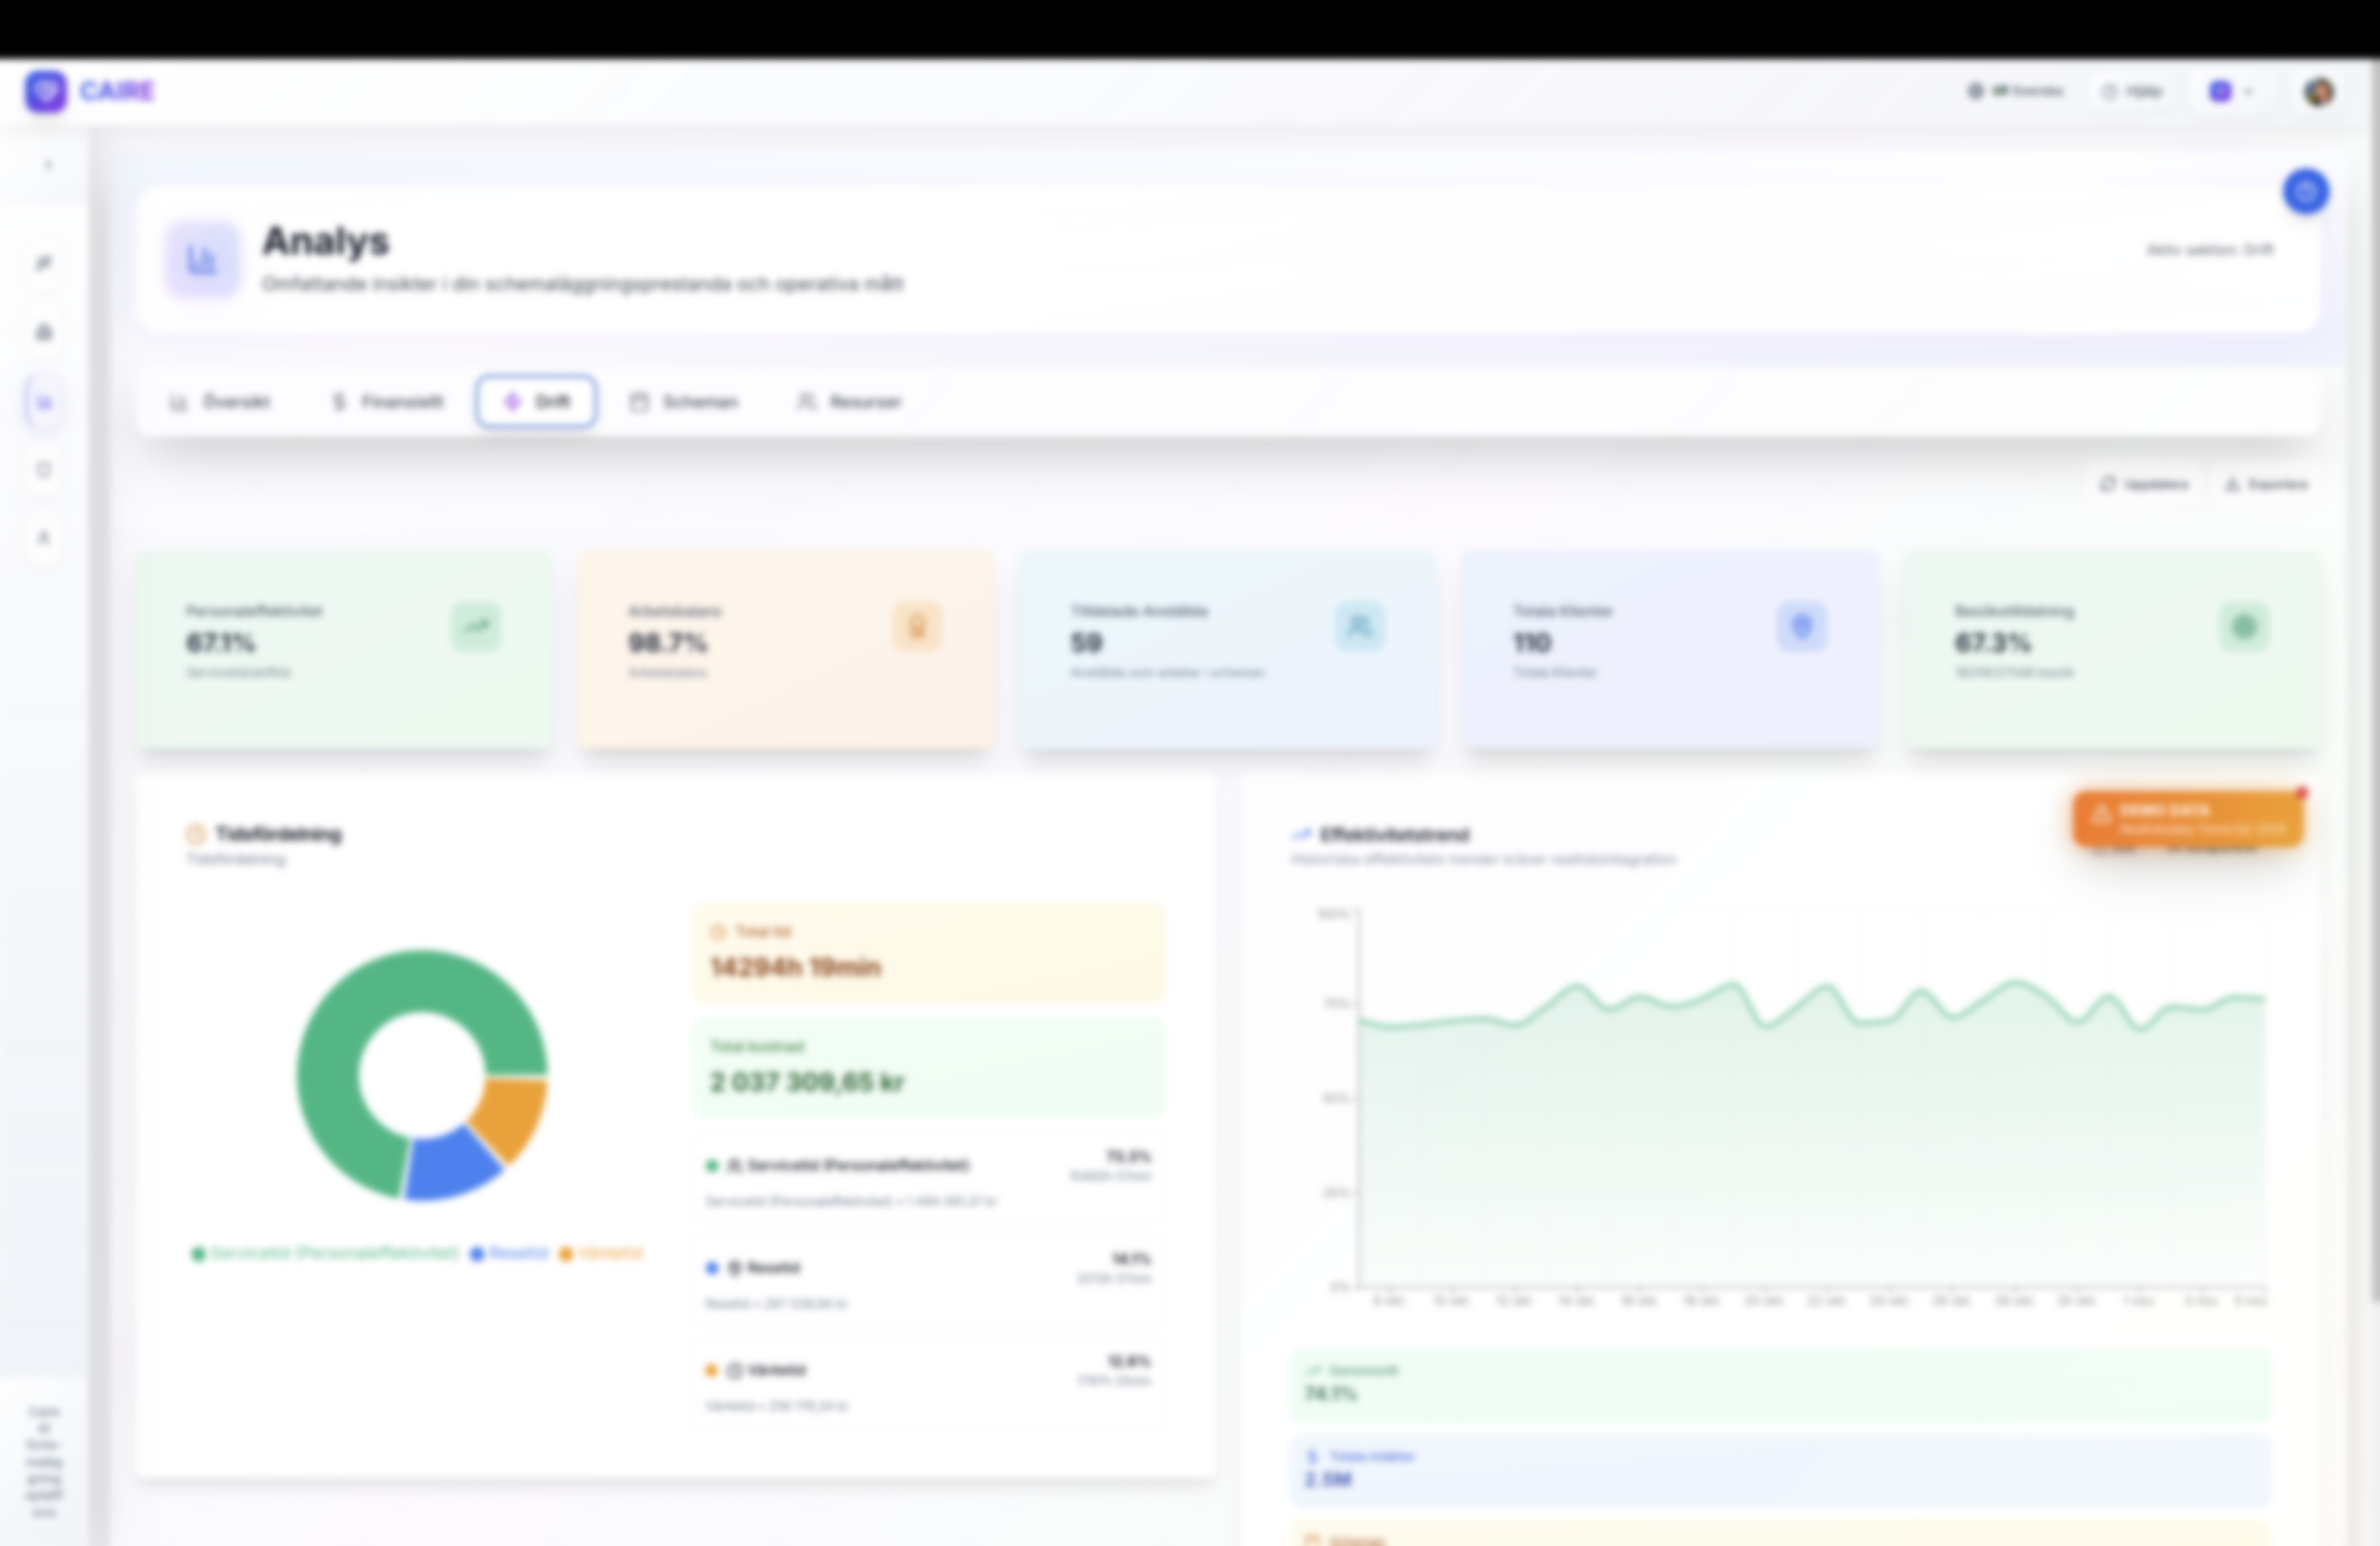
Total employees (active vs inactive), total clients, number of service areas, organization-wide utilization percentage, and total revenue.
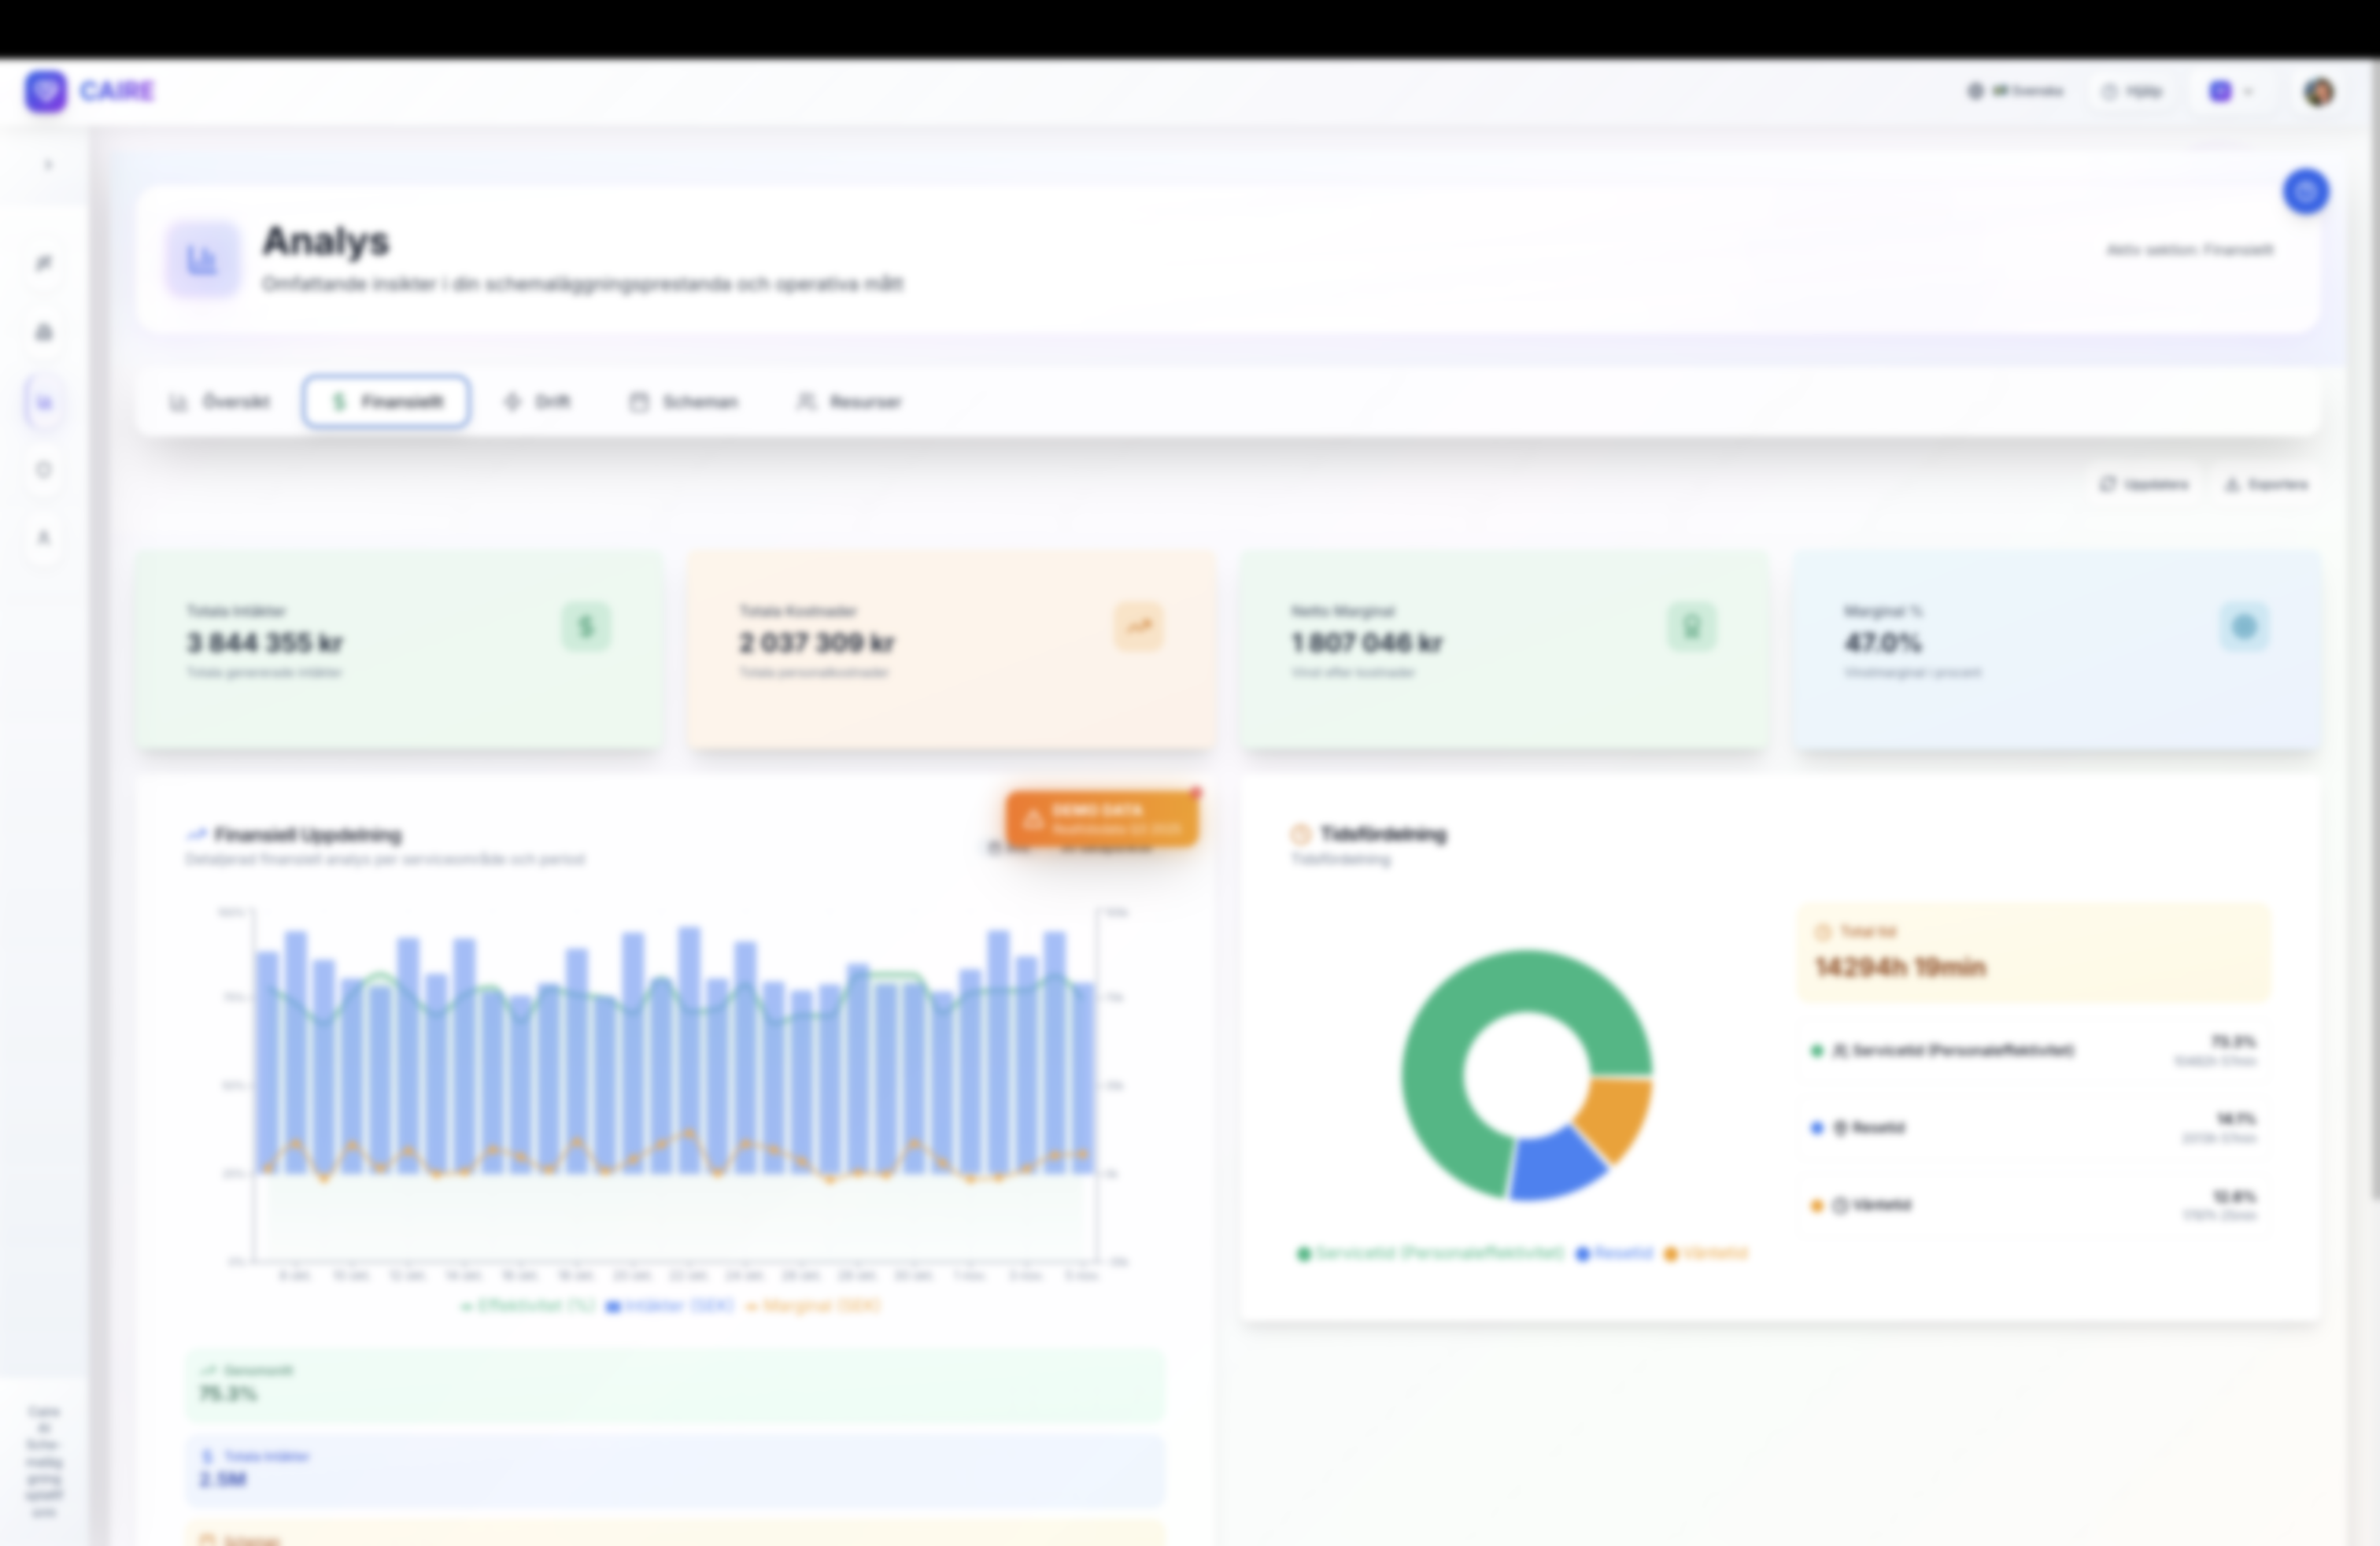
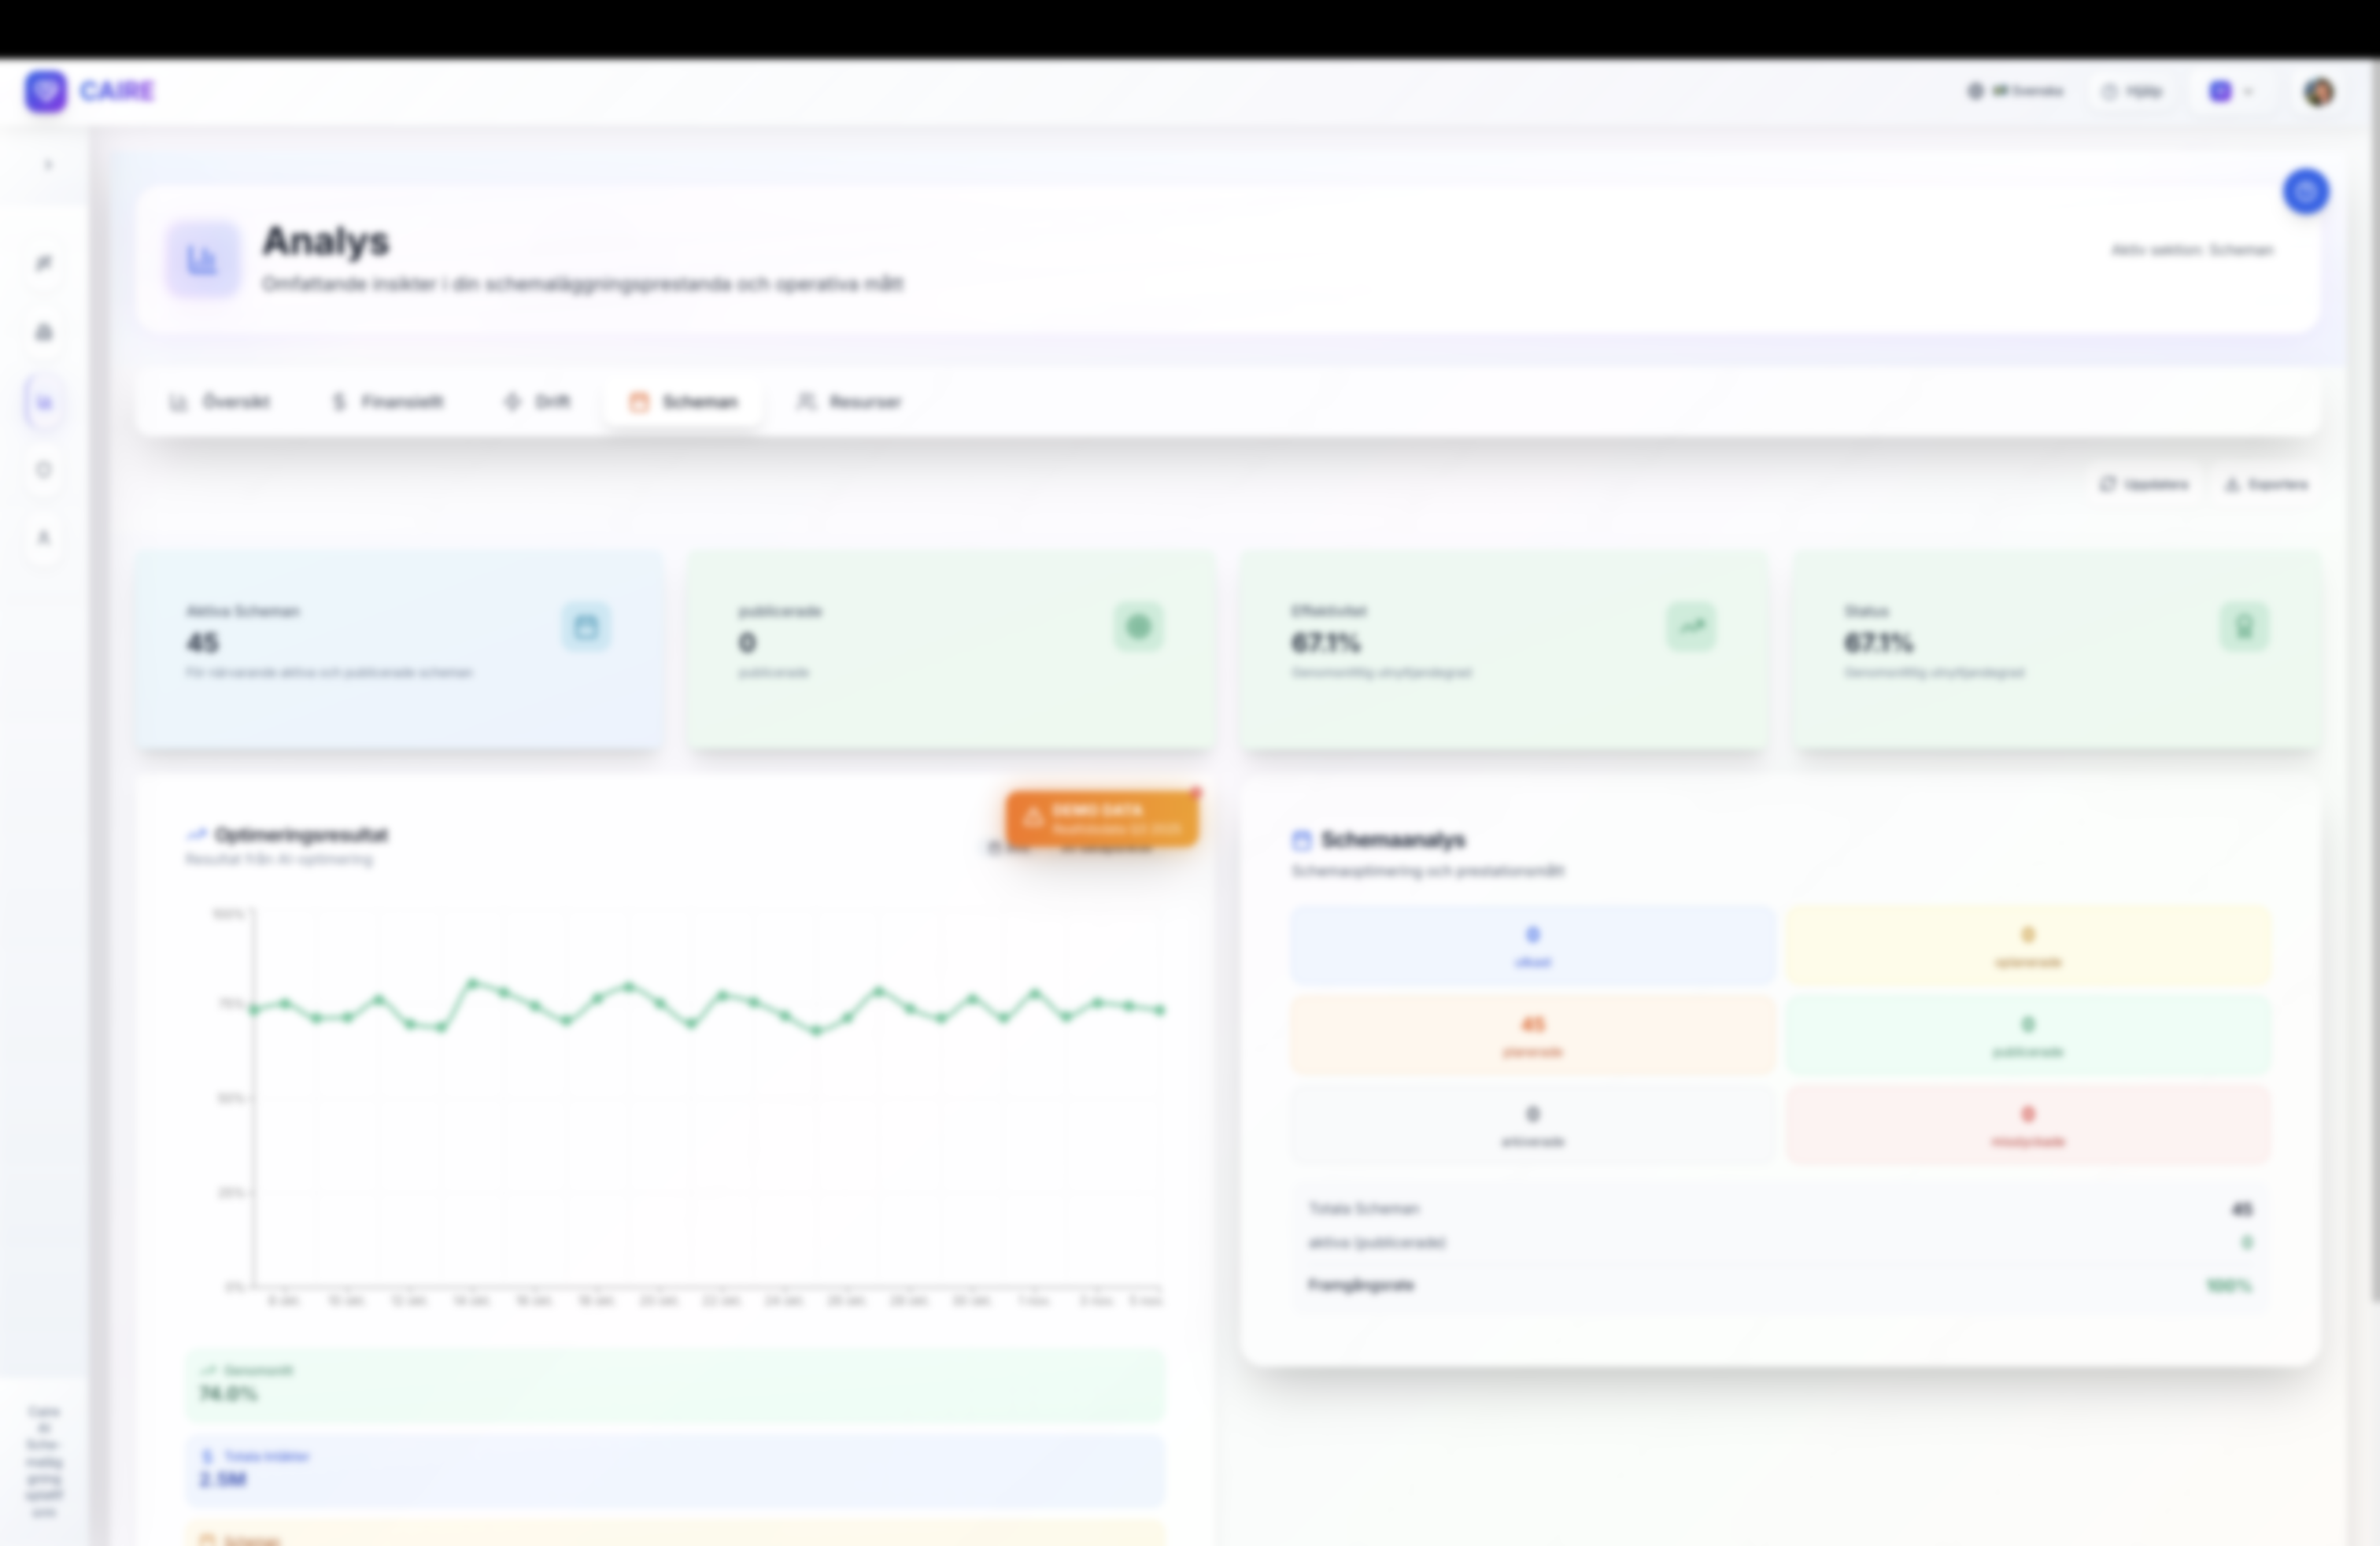
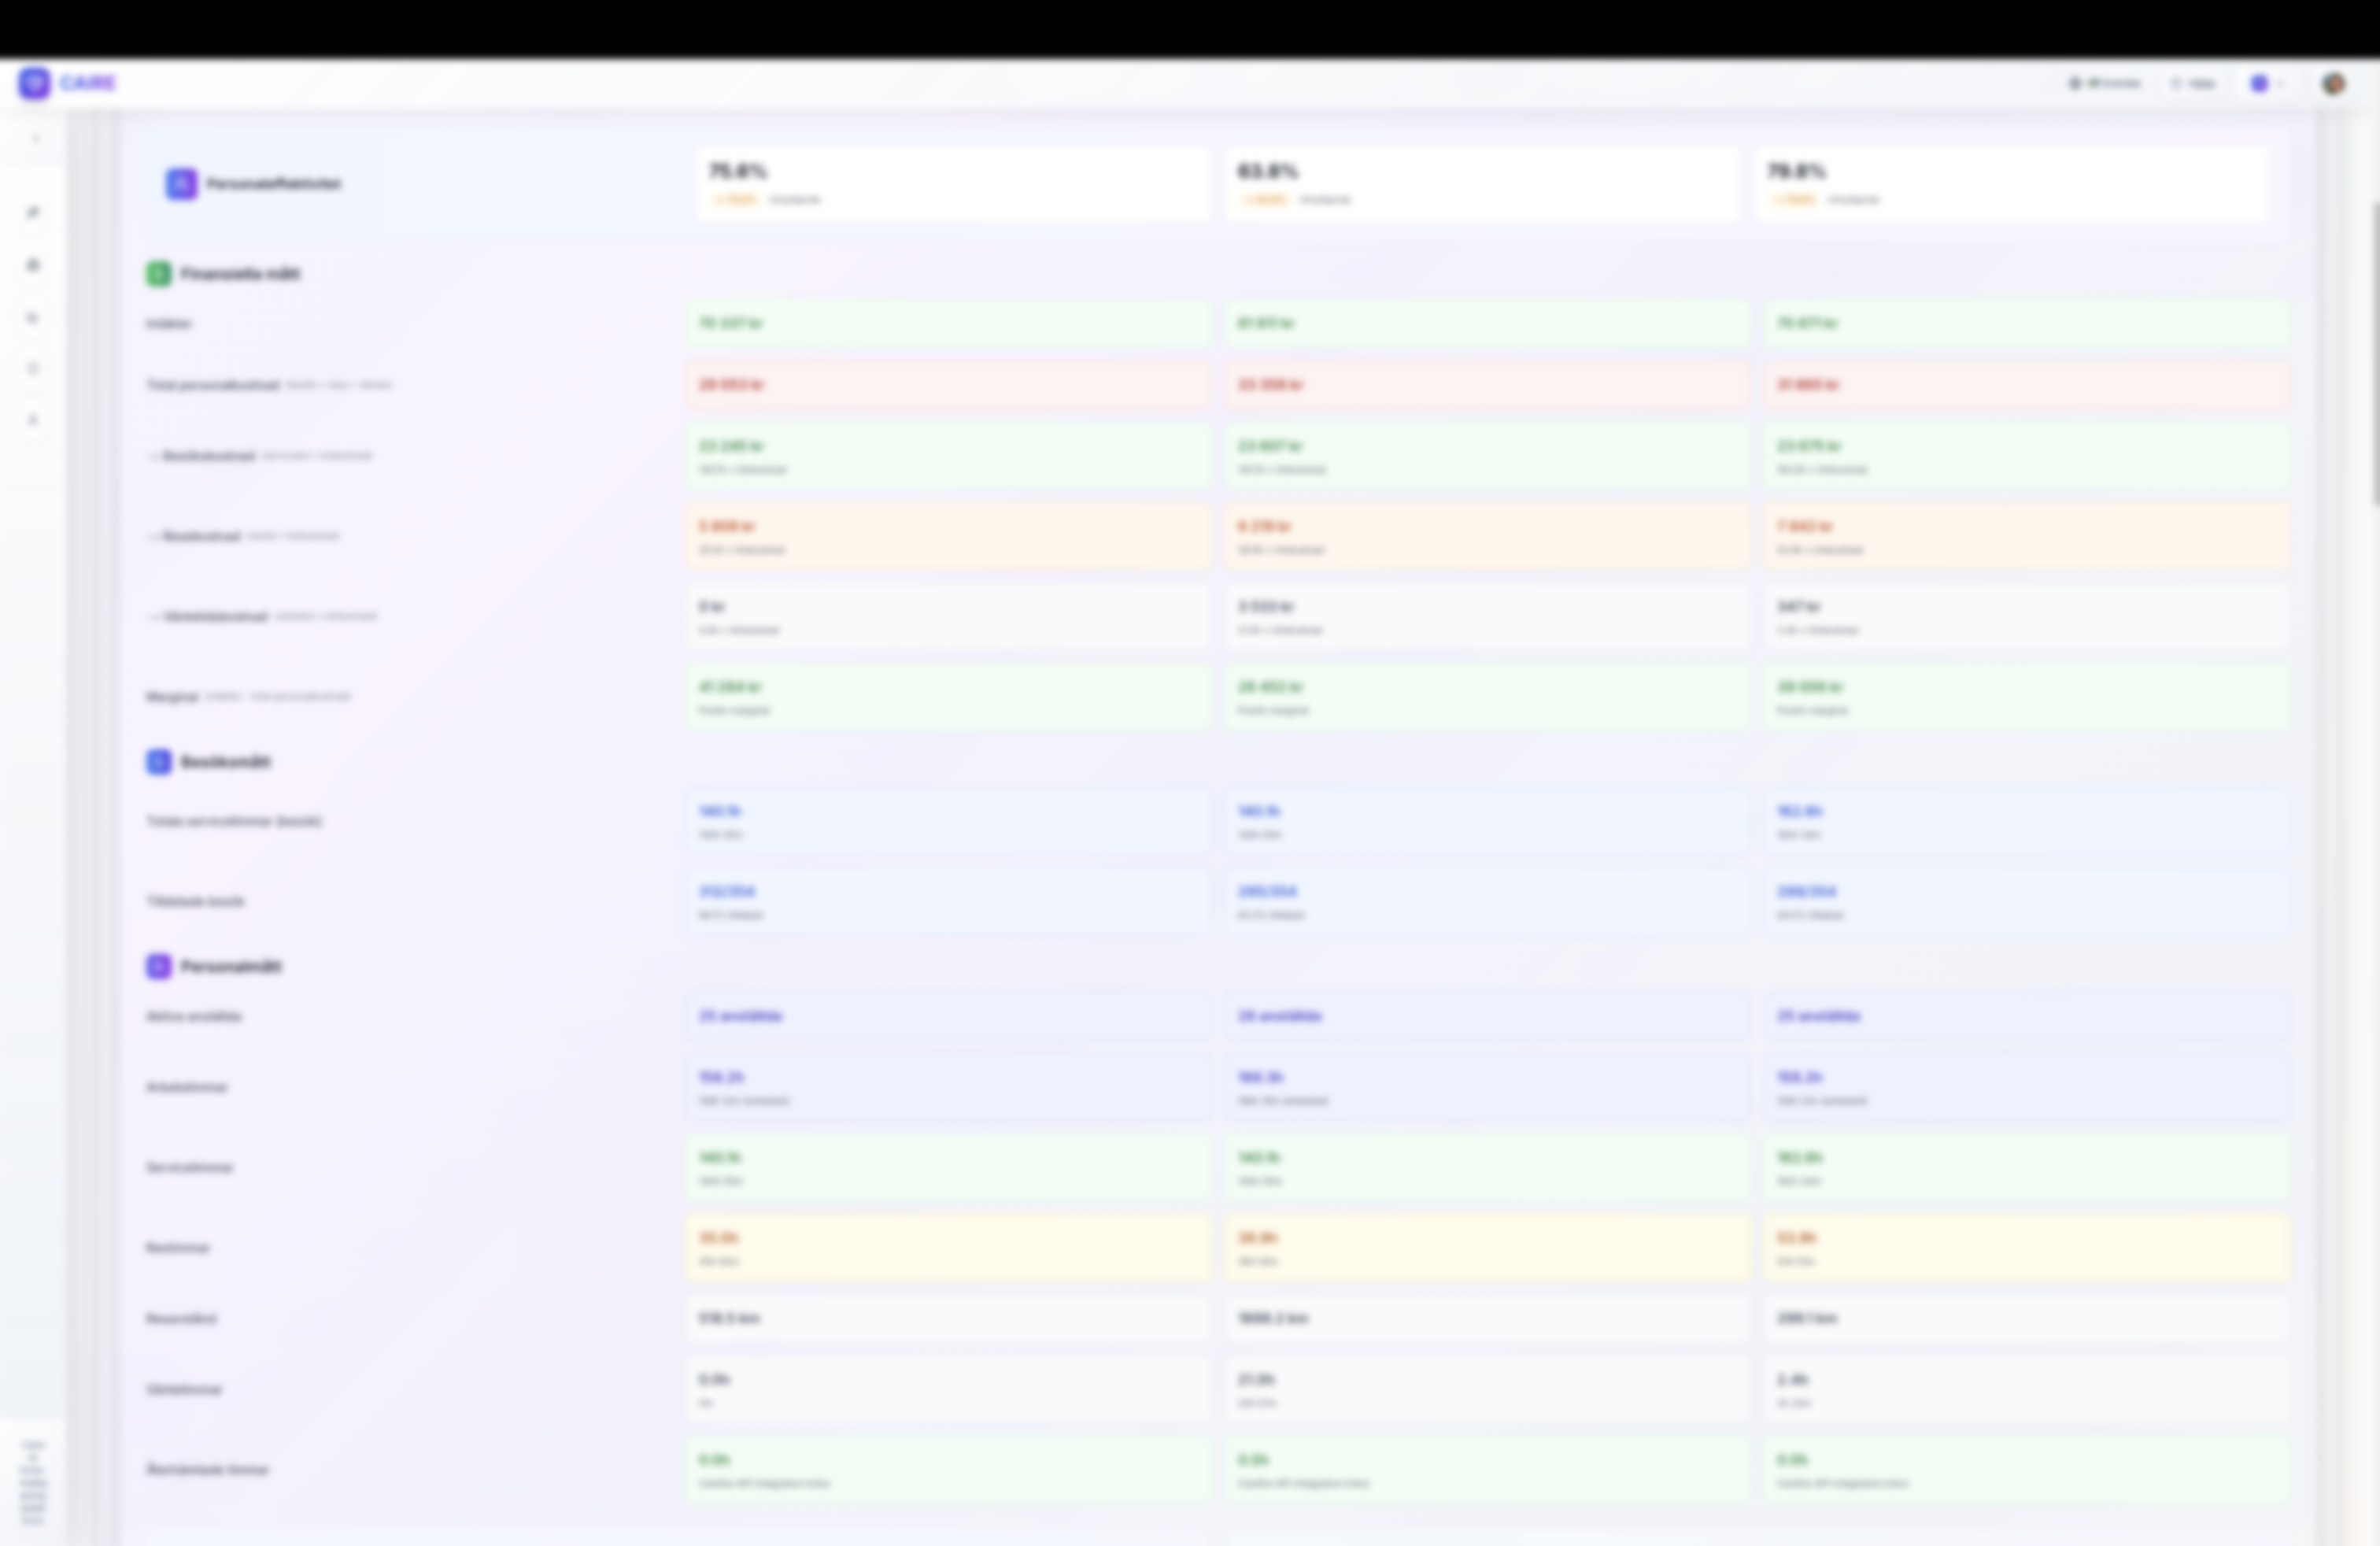
Hierarchical service area analytics with level indicators, personnel count per area, visit metrics, assignment rates, time analytics, staff utilization, and financial metrics with margin calculations.
Sortable table with utilization percentage, total visits handled, hours worked, travel vs service time breakdown, revenue generated, and continuity scores with performance badges (Excellent/Good/Fair/Poor).
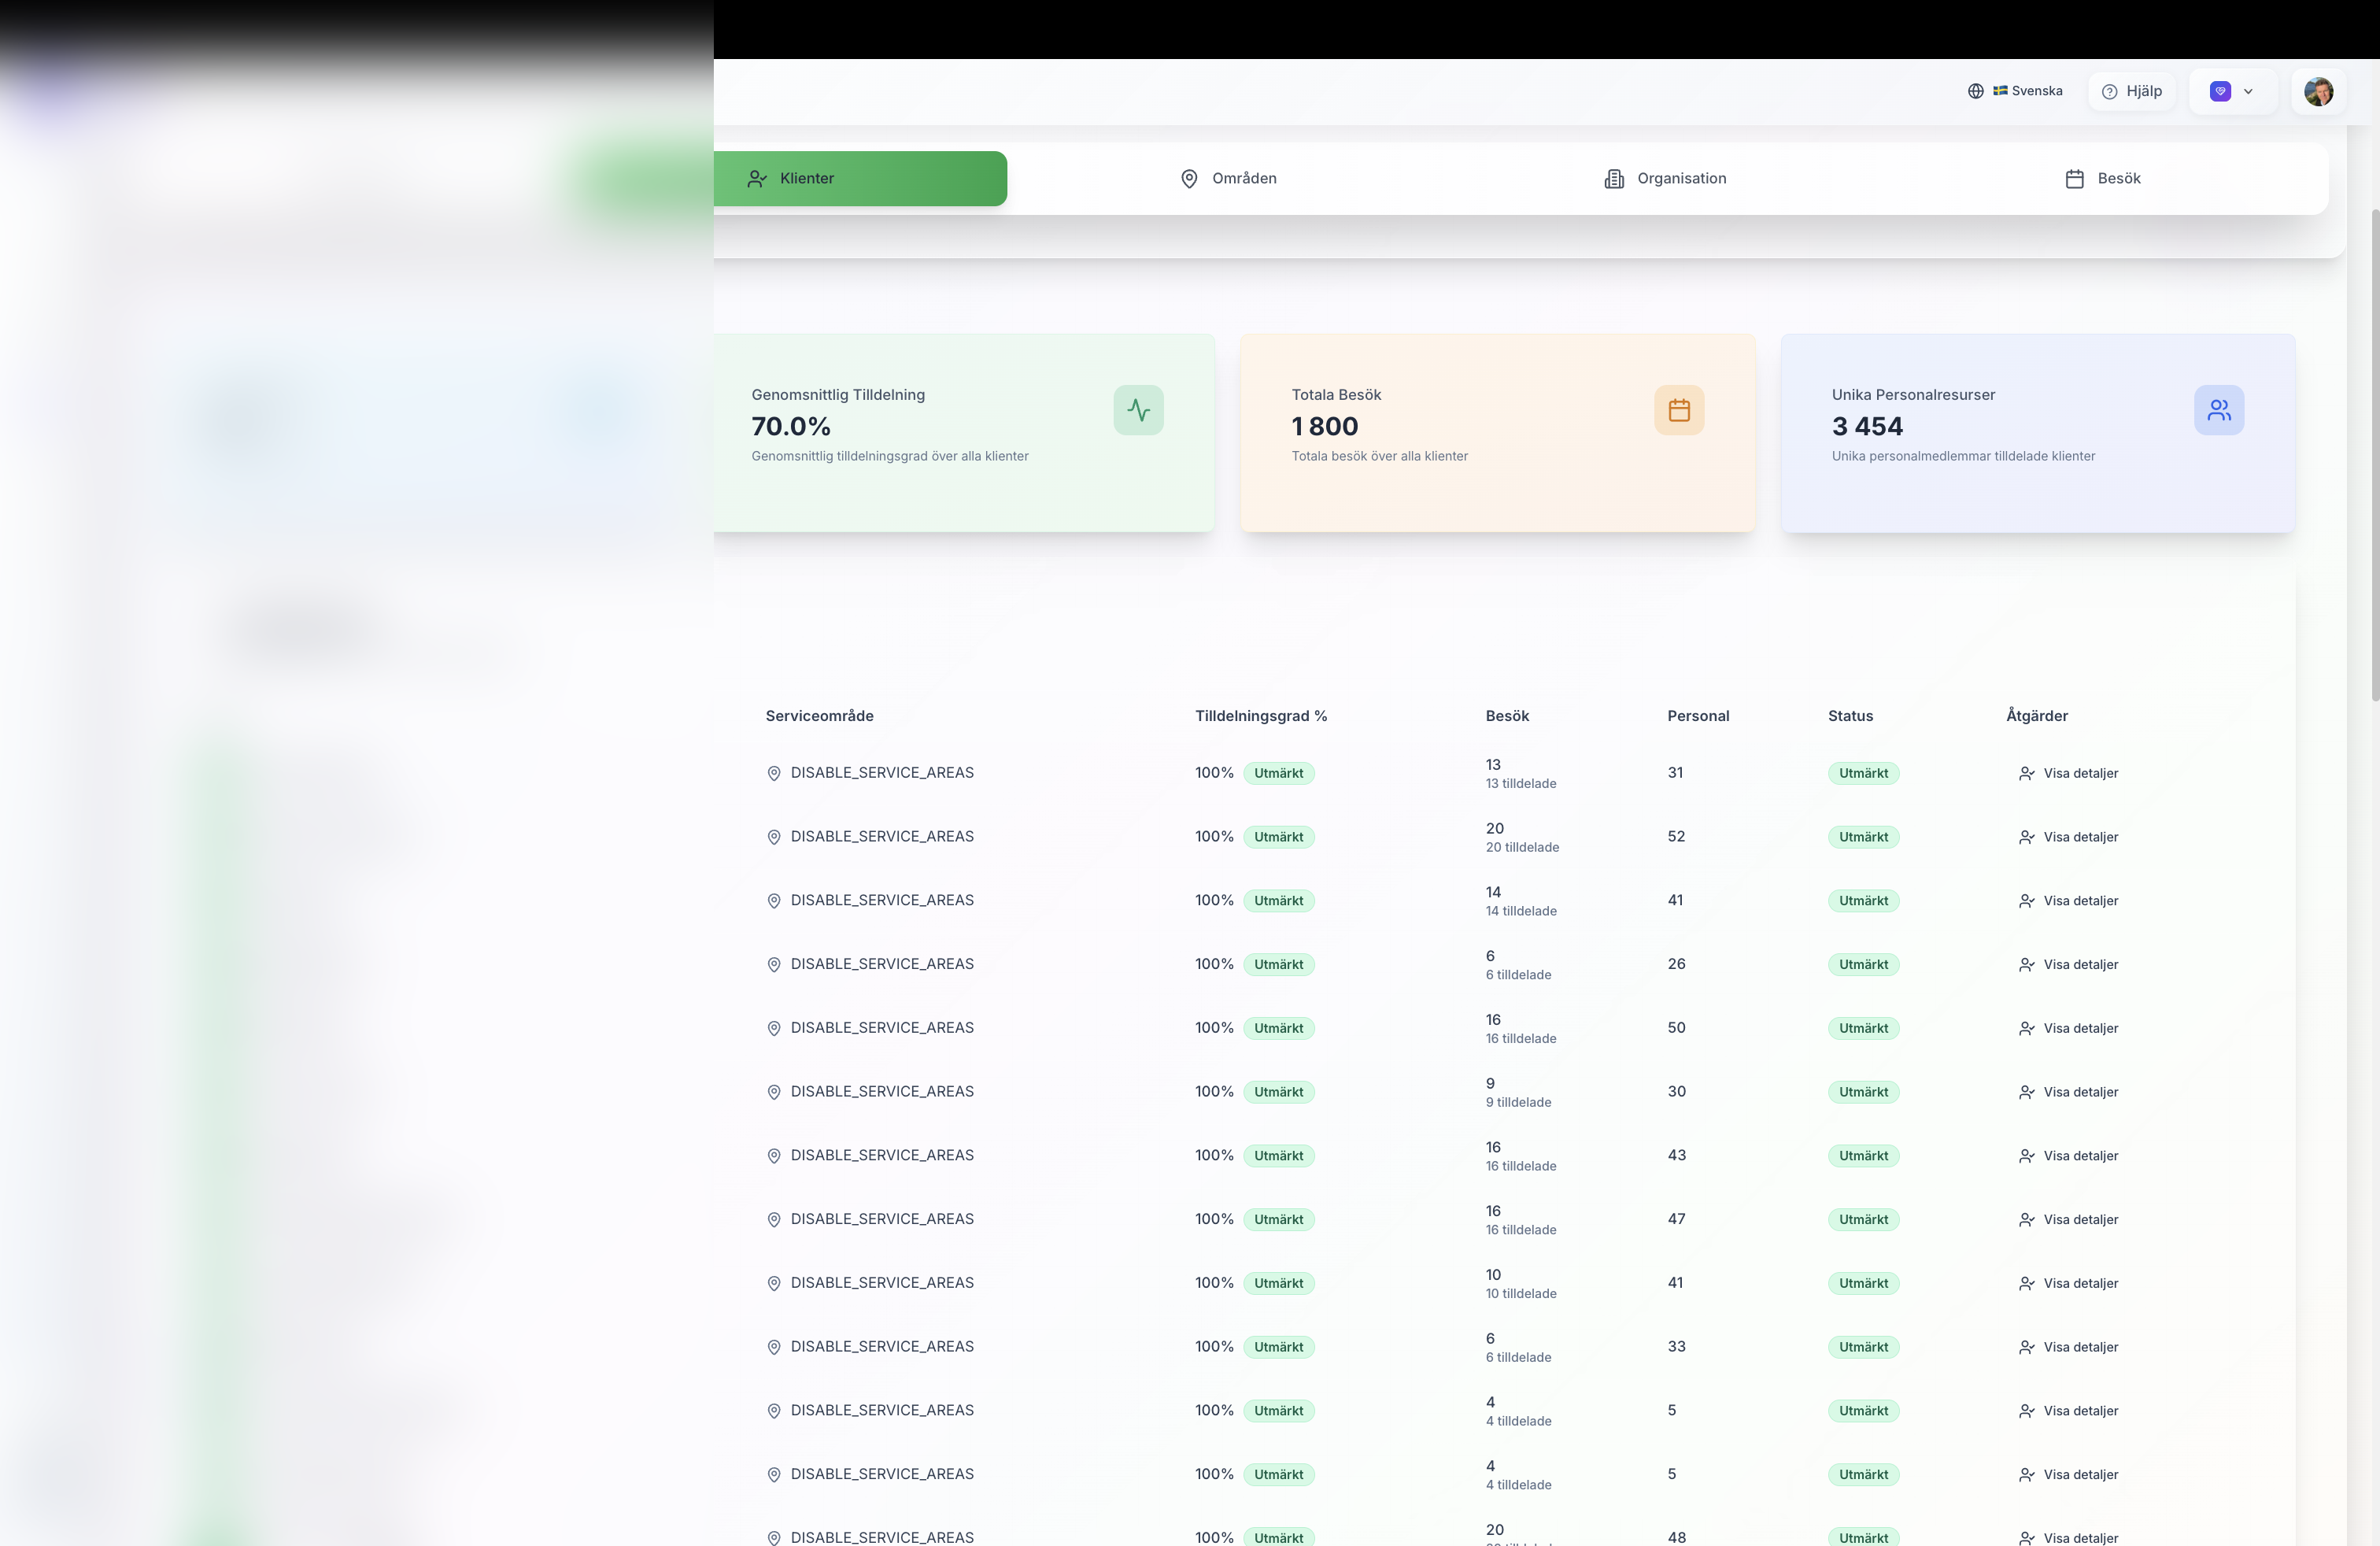
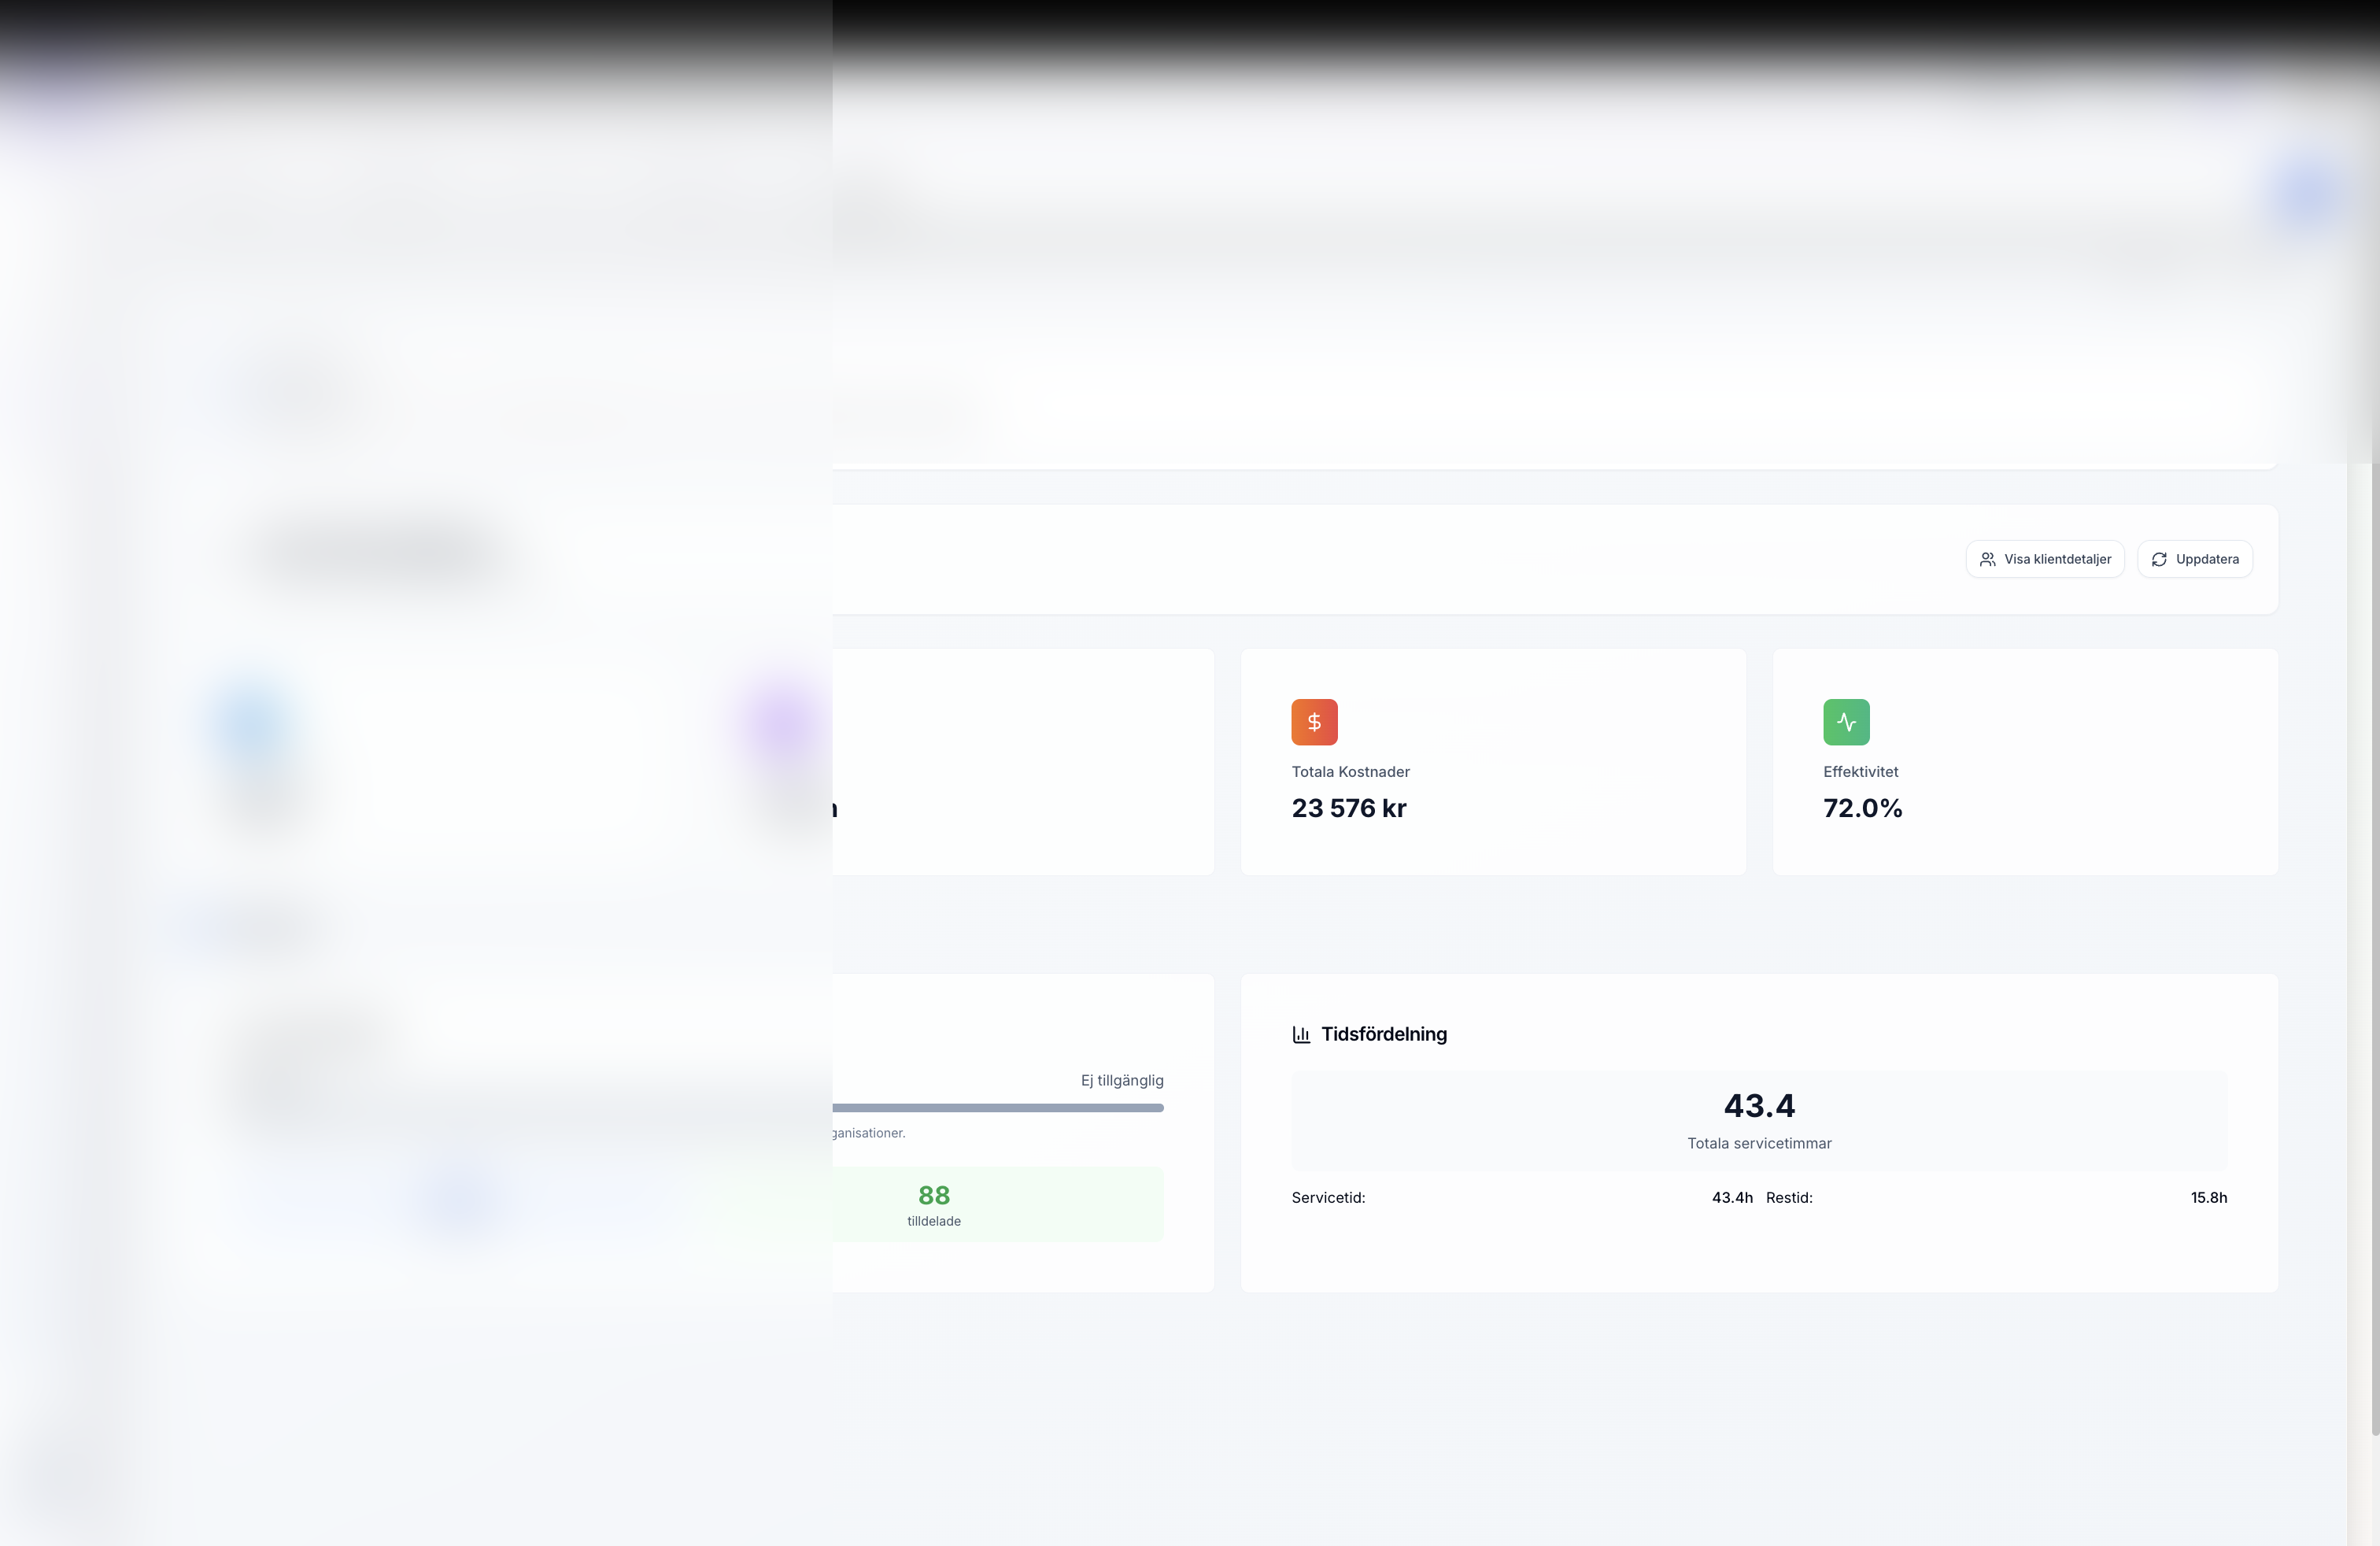
Service area assignments, total visits received, assignment success rates with progress bars, number of unique employees assigned, and continuity scores (fewer unique employees = higher score).
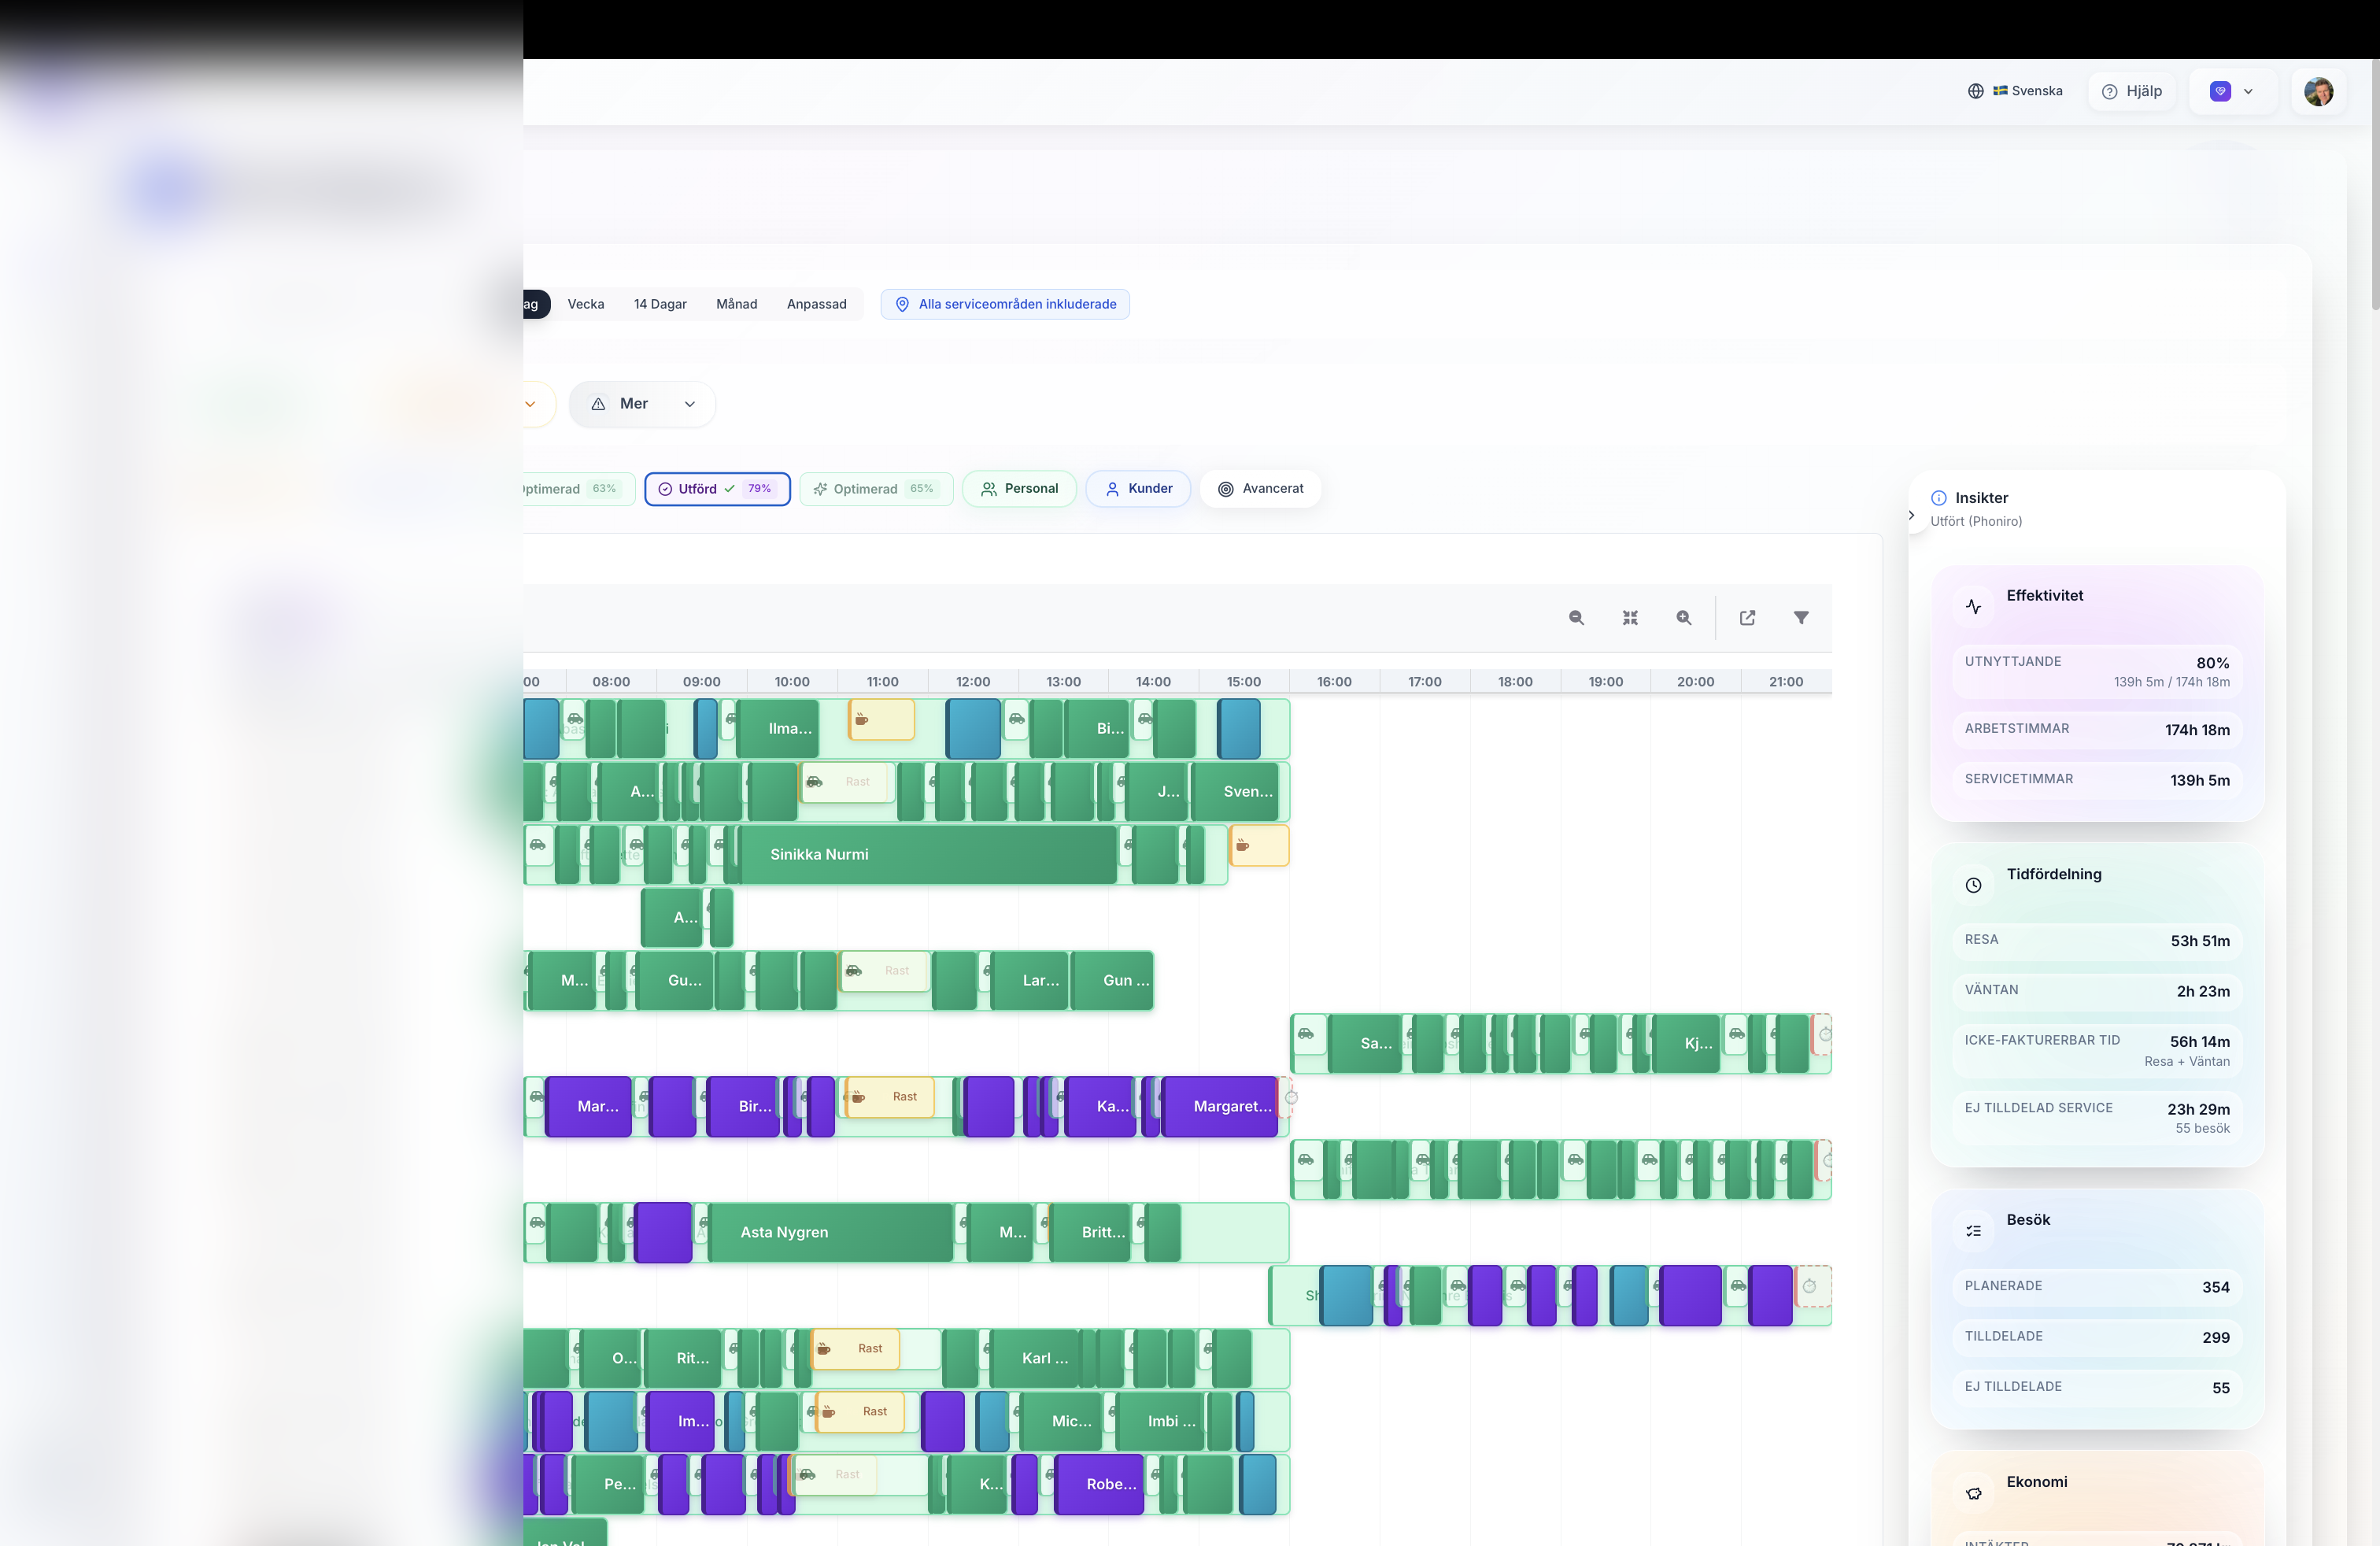
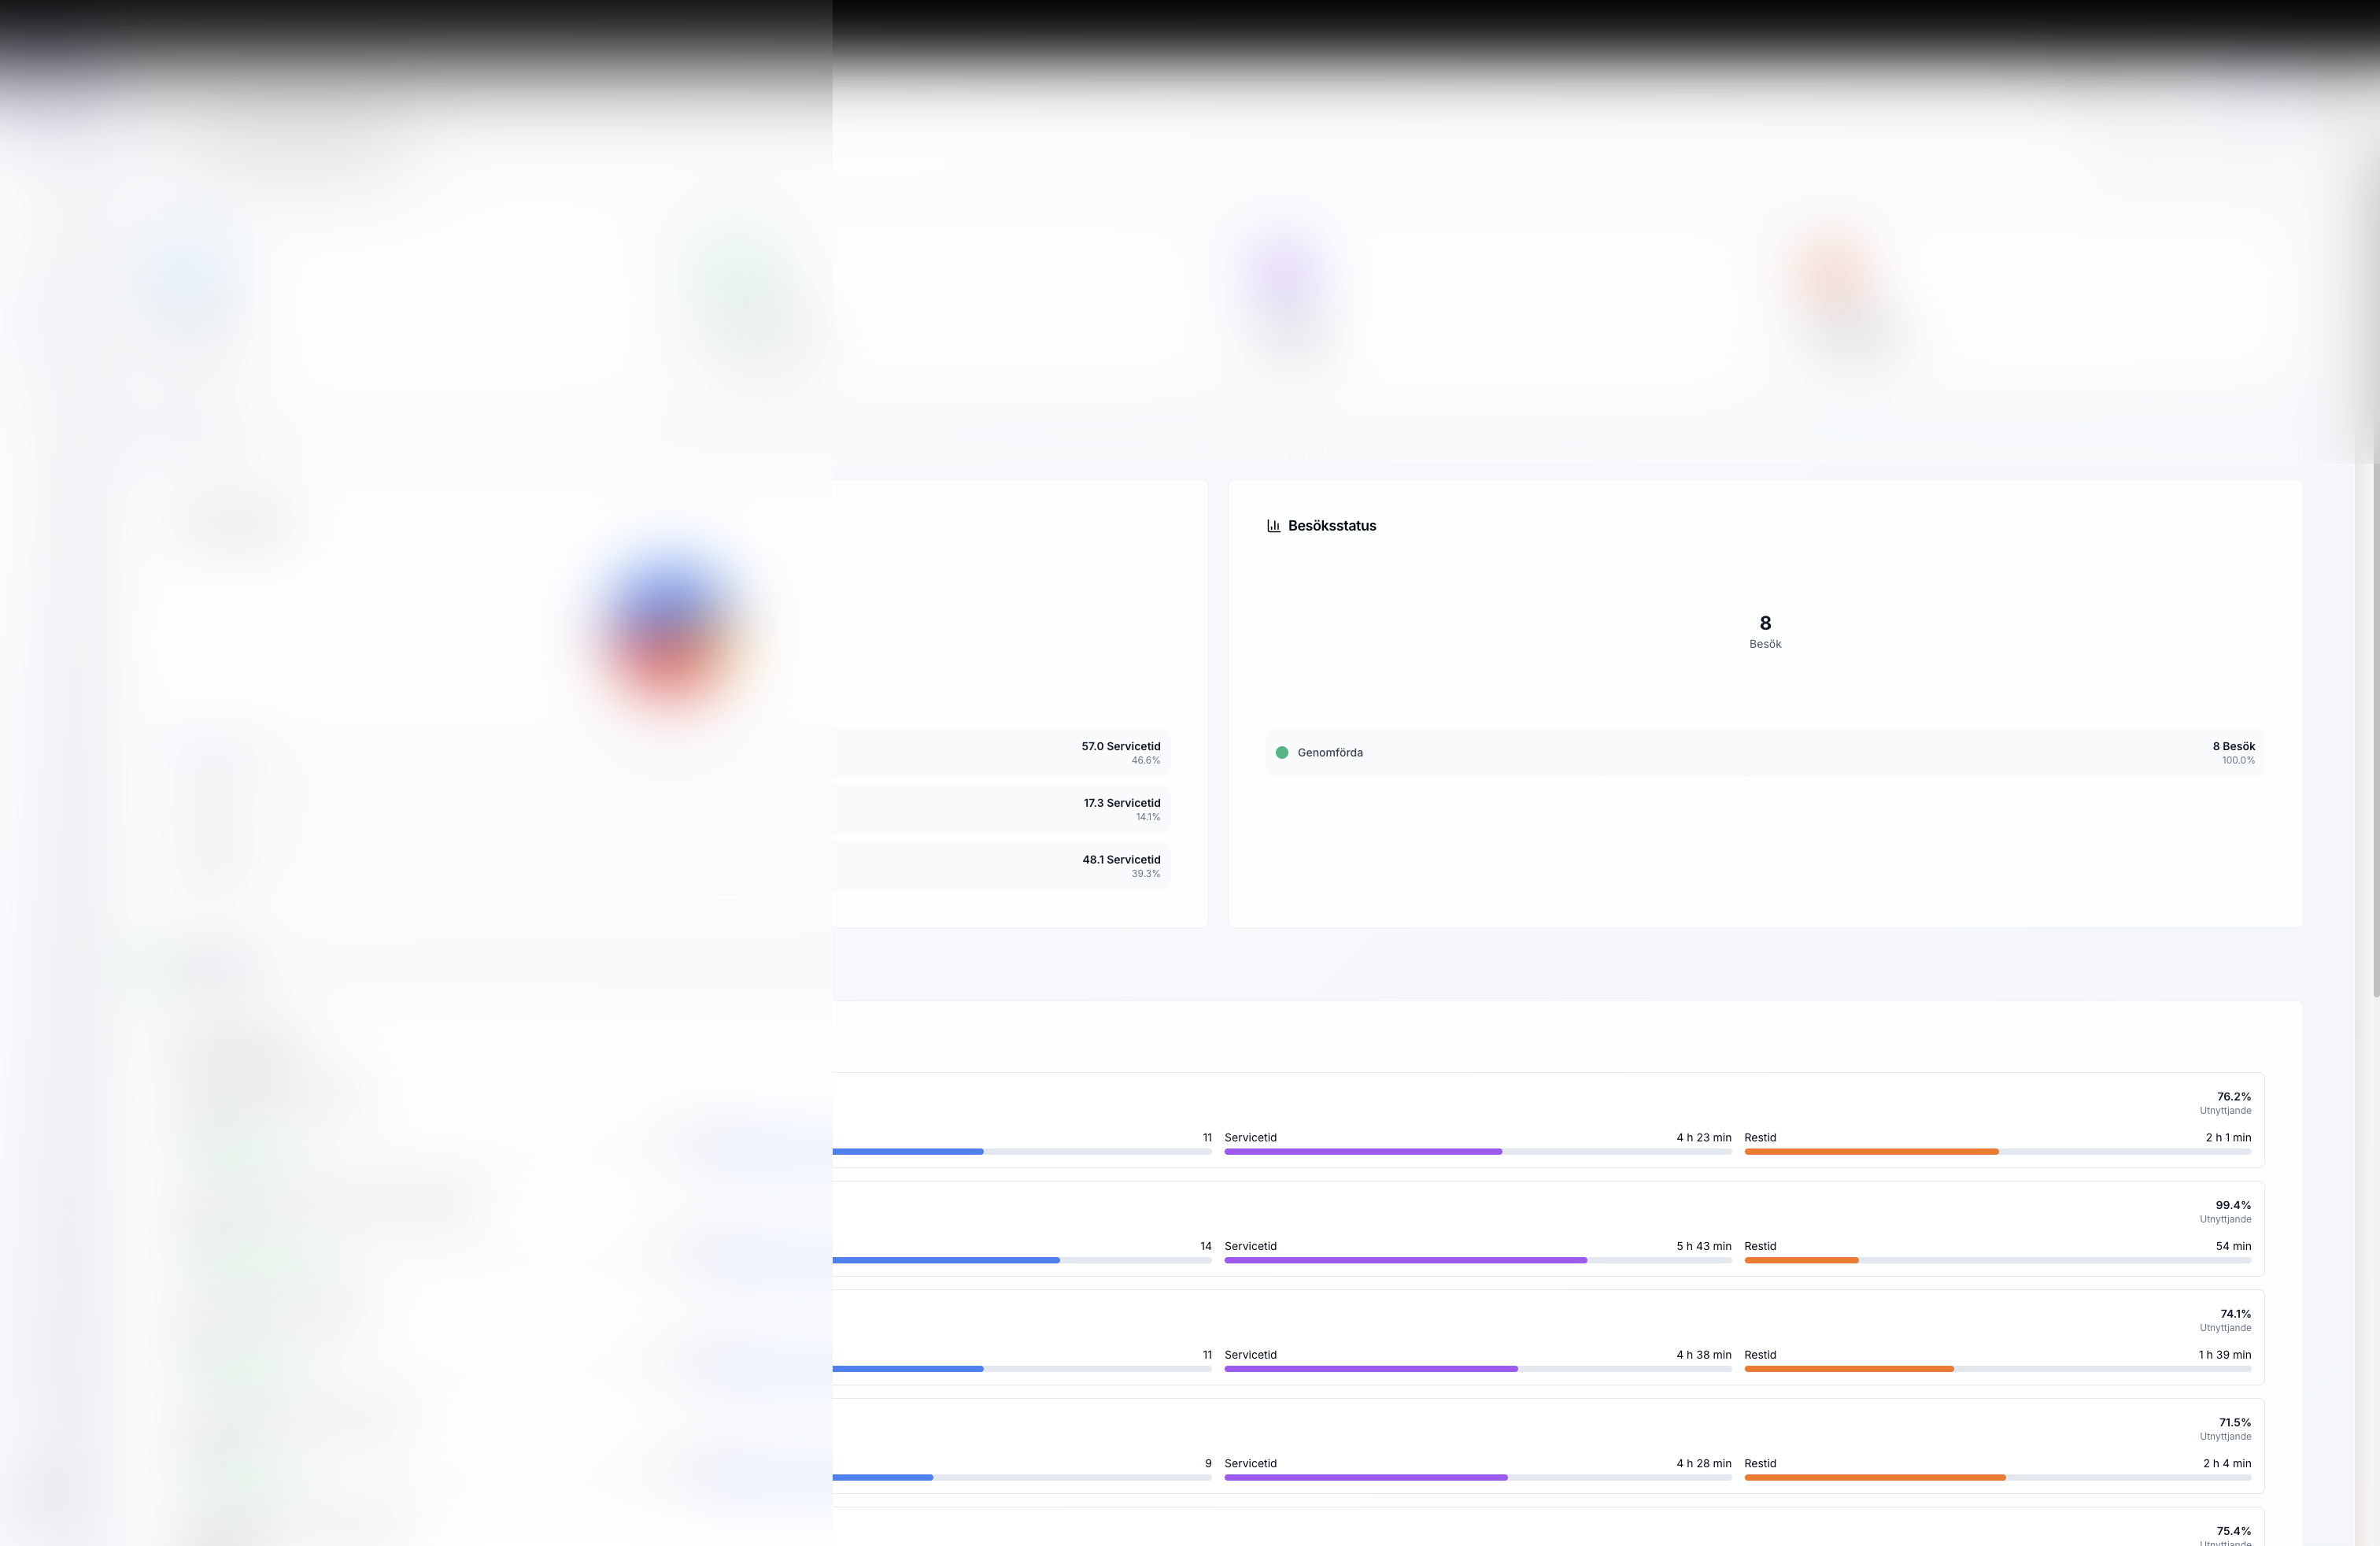
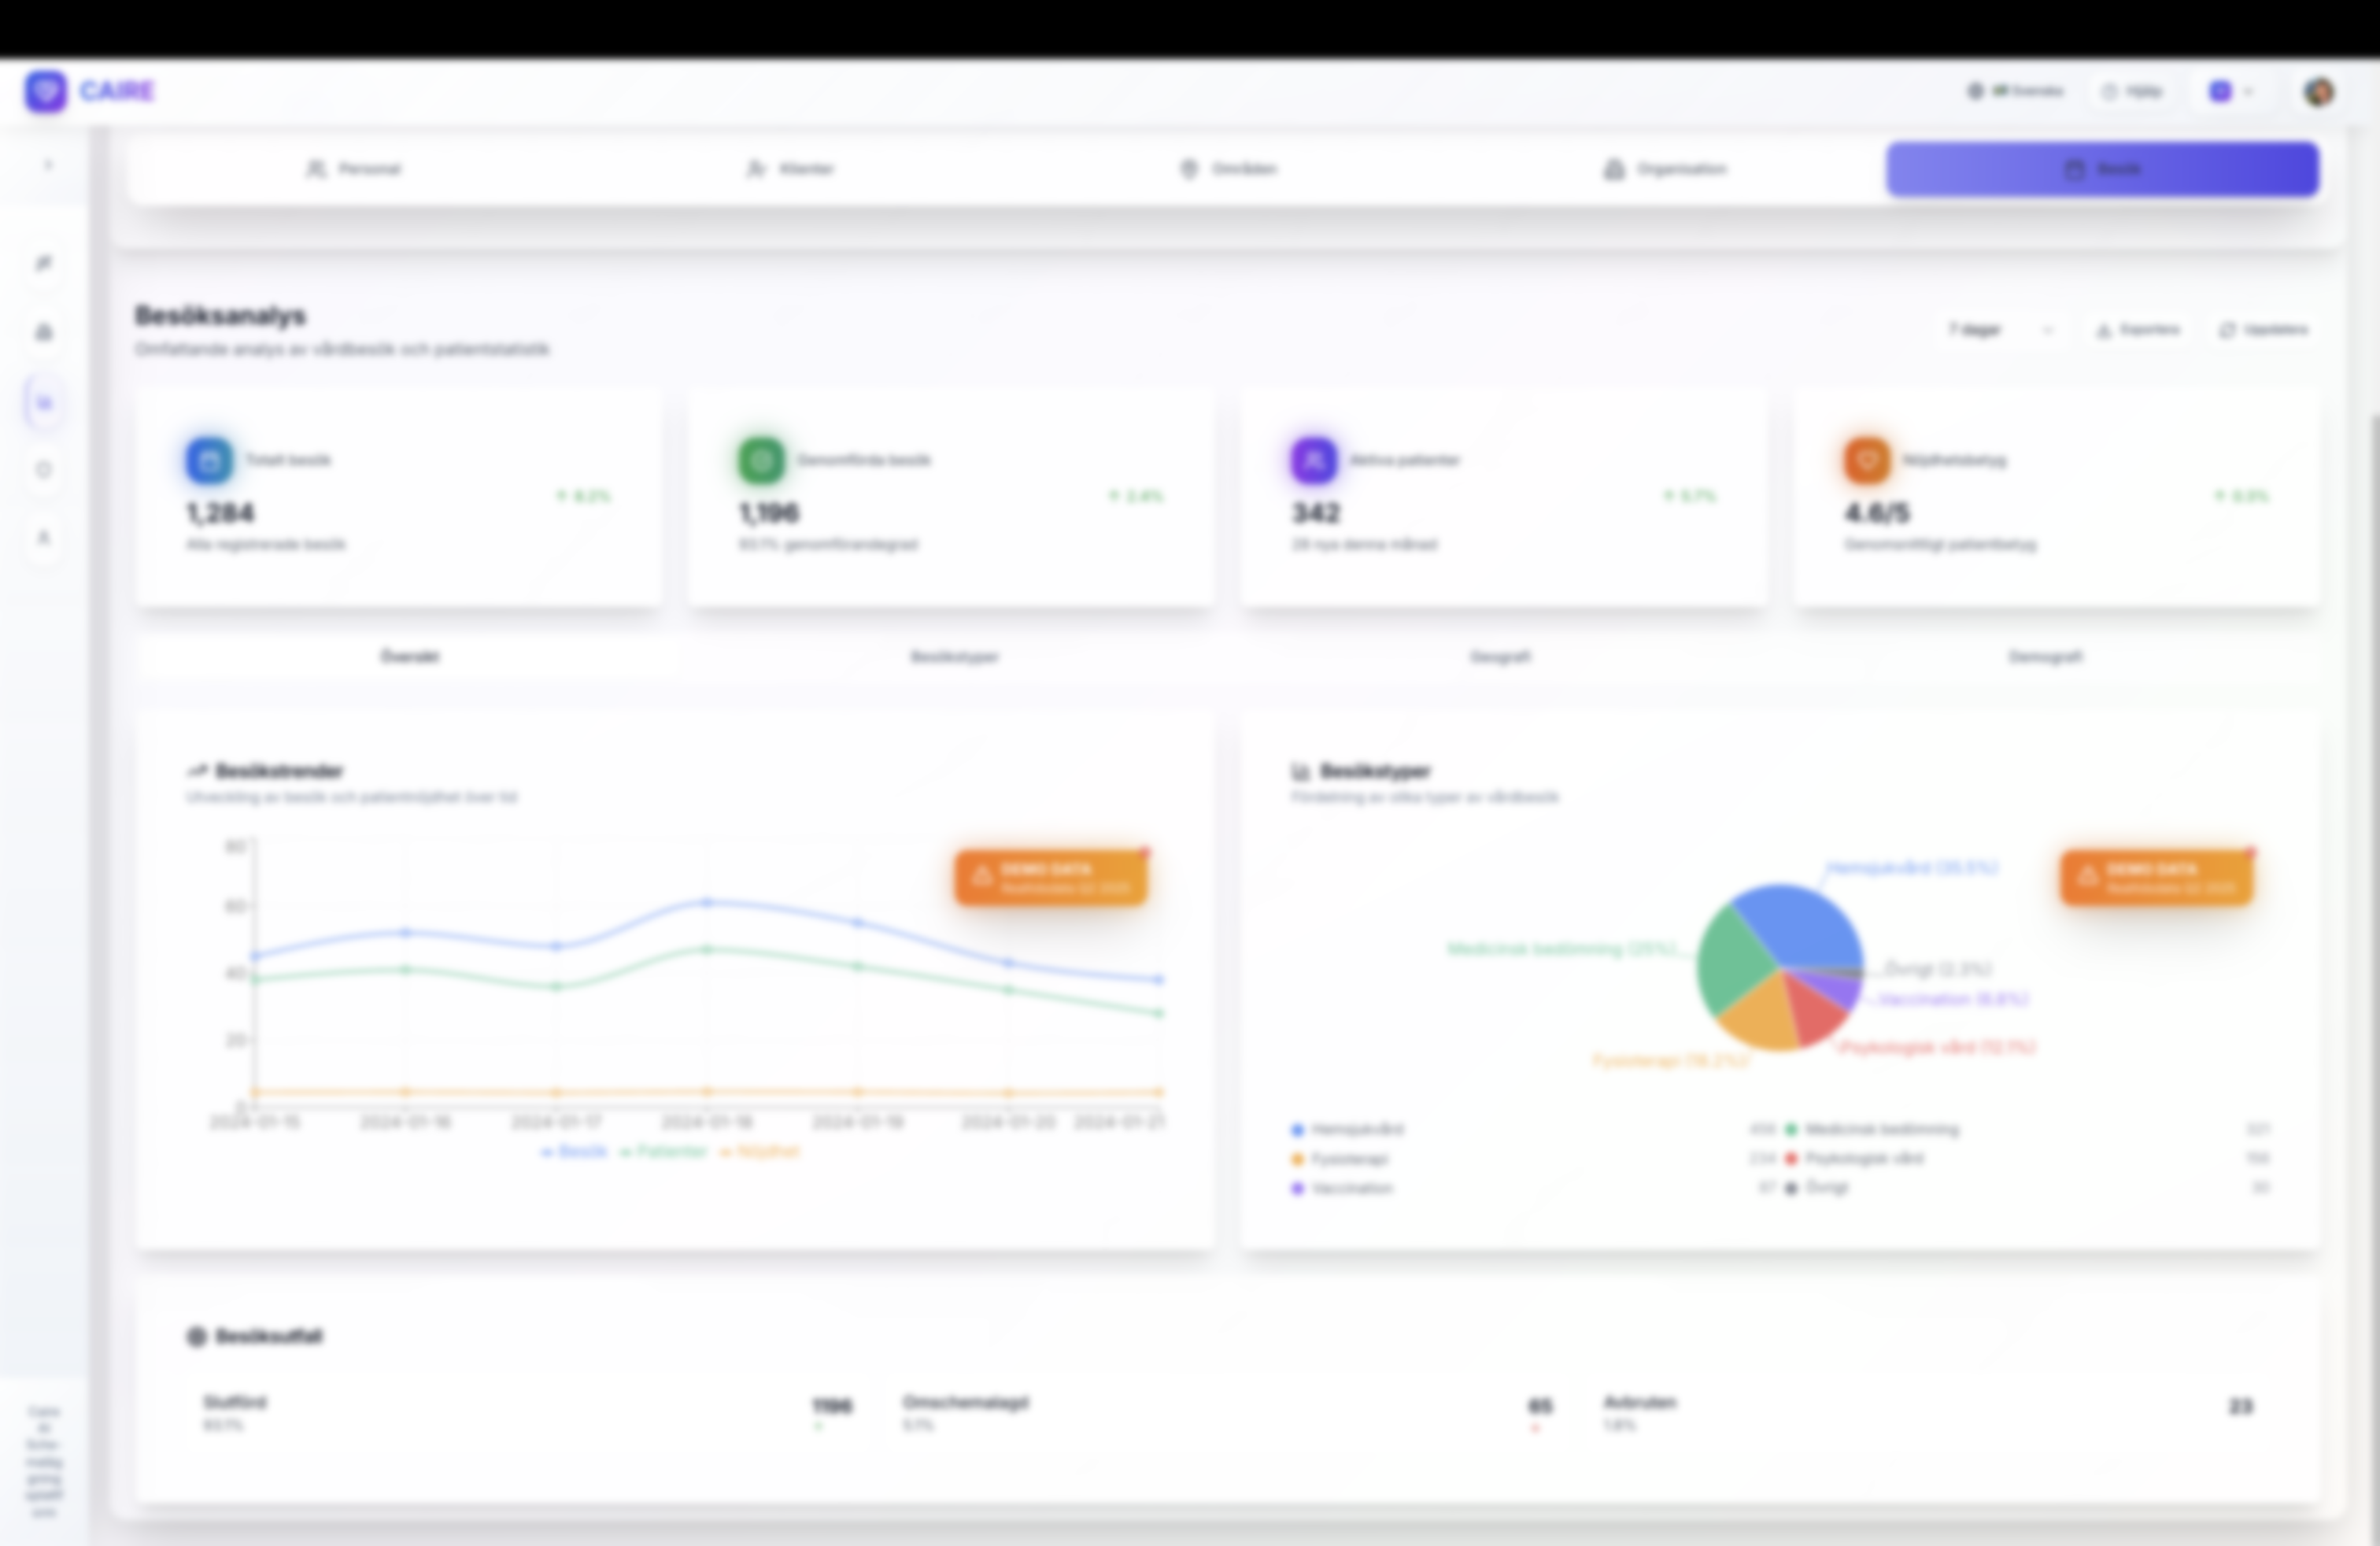
Detailed visit log with client and employee assignments, service types (Hemtjänst, Medicinering, Hushållshjälp), visit duration in minutes, dates, and status badges (Completed/Scheduled/Cancelled).
Measure the business impact of AI-powered optimization
Real-time revenue tracking in SEK with Swedish locale formatting. Cost breakdowns by employee, service area, and service type. Margin analysis with profitability indicators and ROI comparison before/after optimization.
Comprehensive cost tracking including staff costs, travel expenses, and overhead allocation. Interactive pie charts and bar charts showing cost distribution patterns and optimization opportunities.
Travel time optimization tracking with percentage targets. Service quality scores and indicators. Constraint satisfaction rates. Unused hours recapture rates with potential revenue calculations.
Transform raw data into strategic insights
The analytics system provides transparency into the true ROI of AI optimization. Organizations can see exactly how much time, money, and resources are saved through intelligent scheduling. Every metric is traceable back to real optimization jobs and operational data.
Track improvements over time with historical comparisons. See how utilization rates, margins, and efficiency metrics evolve as you optimize.
Start with high-level metrics and drill down to individual employees, clients, or service areas for detailed investigation.
Sortable tables, filterable data, and multiple time period options allow you to analyze data exactly how you need it.
Performance badges, status indicators, and trend arrows help you quickly identify areas for improvement and celebrate successes.
Extract PDF or Excel reports for sharing with management. All analysis is centralized for easy access and continuous improvement initiatives.
Metrics update automatically as new optimization jobs complete. Always have current data for informed decision-making.
Four simple steps to unlock powerful insights
Ensure your organizational data is complete with employees, clients, and service areas properly configured in the system.
Import schedules and run AI optimizations. Each optimization job generates comprehensive metrics that feed the analytics system.
Navigate through the five analytics sections to understand performance, identify opportunities, and validate optimization results.
Use insights to refine optimization parameters, adjust resource allocation, and continuously improve operational efficiency.
Connect your analytics insights with how schedules are built and resources are staffed by jumping to these sections.