Build a connected resource hub that feeds AI scheduling, scenario planning, and analytics. Keep every caregiver, client, and service area synchronized in real time so teams can focus on delivering exceptional care, not spreadsheets.
Explore the dedicated client and employee views that power the CAIRE platform
Manage all aspects of your home care resources from one unified platform
Complete staff directory with skills tracking, availability management, and schedule integration. Track certifications, working hours, preferences, and performance metrics. Seamlessly integrated with AI optimization.
Client directory with visit scheduling, preference management, and service tracking. Store addresses with coordinates, time window preferences, special needs, and care continuity tracking for optimal assignments.
Hierarchical service area organization with multi-level support. Define geographical regions, assign staff, track performance metrics, and optimize resource allocation across areas.
Centralized organization configuration including working time rules, skills framework, continuity preferences, and integration settings. Single source of truth for all operational parameters.
Your care team is your most valuable resource – manage them effectively
Employee data integrates directly with schedule optimization. Skills, availability, and preferences are automatically considered when AI generates optimal schedules, ensuring the right caregiver for the right client every time.
Store comprehensive employee data including contact info, certifications, skills, working hours, and employment status.
Track skills like medical care, mobility support, dementia care, and language proficiency for proper client matching.
Manage weekday availability, working hours (start/end times), vacation periods, and shift preferences for accurate scheduling.
Track both monthly salaries (fixed contracts) and hourly rates (flexible employees). Supports multiple payment models (A, B, C, D) with PAID/UNPAID break policies for accurate cost calculation.
Track utilization rates, total visits handled, hours worked, revenue generated, and continuity scores for each employee.
Employee data feeds automatically into AI optimization. Changes to availability or skills immediately impact schedule calculations.
Easily manage employee status. Inactive employees are excluded from scheduling while historical data is preserved.
All employee routes start and end at office location. First visit begins after travel from office; last visit must allow time to return before shift end. Configurable travel buffers ensure realistic scheduling.
Hierarchical Configuration: Compensation settings can be configured at Organization, Service Area, or Individual Employee levels. More specific settings override general defaults.
| Setting | Description | Configuration Levels |
|---|---|---|
| Monthly Salary | Fixed monthly compensation for full-time/part-time employees | Individual Employee |
| Hourly Rate | Hourly compensation for flexible/temporary employees | Individual Employee, Service Area, Organization |
| Payment Model | How hours are calculated (A=Service, B=Service+Travel, C=Shift to Last, D=Full Shift) | Organization (applies to all hourly employees) |
| Break Policy | PAID or UNPAID breaks | Organization, Service Area, Individual Employee |
| Break Duration | Standard break length (e.g., 30 or 60 minutes) | Organization, Service Area |
Example Hierarchy:
Deliver personalized care through intelligent client data management
Store complete addresses with GPS coordinates. Enables accurate route optimization and travel time calculations. Supports geocoding for automatic coordinate assignment.
Define preferred visit times for each client. AI optimization respects these preferences while maximizing overall efficiency. Supports multiple time windows per client.
Track dietary needs, mobility requirements, language preferences, and caregiver preferences. Ensures appropriate staff matching and quality care delivery.
Monitor total visits received, assignment success rate, unique caregivers count, and continuity scores. Track service quality and client satisfaction over time.
Municipality contracts allocate fixed hours per month (e.g., 100h/month). Caire tracks usage, identifies unused hours at risk of expiring, and suggests recapture strategies through visit extensions or additional services.
Define a primary caregiver (contact person) for each client with clear visit minimums. Example: Lisa must complete at least 18 of Anna's 60 monthly visits while staying inside the caregiver-limit guardrail. The solver enforces these targets automatically.
Set the maximum number of unique caregivers per client in a rolling 14-day window (default 10, tighten to 6–8 for high-need clients). The optimization engine tracks the caregiver pool size and blocks assignments that would exceed the limit.
Hierarchical Configuration: Client settings can be set at Organization, Service Area, or Individual Client levels for maximum flexibility.
| Setting | Description | Configuration Levels | Example |
|---|---|---|---|
| Monthly Allocation Hours | Municipality-approved service hours per month | Individual Client | 100h/month for Anna |
| Billing Rate | Revenue per service hour for financial tracking | Individual Client, Service Area, Organization | 500 SEK/hour municipality contract |
| Continuity Caregiver Limit | Maximum number of distinct caregivers allowed per client within a rolling period (default 14 days) | Individual Client, Service Area, Organization | 10 caregivers per 14 days (tighten to 6–8 for dementia or palliative care) |
| Responsible Caregiver | Primary caregiver (contact person) for client | Individual Client | Lisa assigned to Anna (lead caregiver designation) |
| Minimum Lead Visits | Minimum number of visits the responsible caregiver must complete per period | Individual Client | Lisa: ≥18 of Anna's 60 monthly visits |
| Time Window Flexibility | Allowed time buffer for visit start times | Individual Client, Service Area, Organization | ±5 min (strict) vs ±30 min (flexible) |
Continuity Guardrail Example:
Client: Anna L. (dementia diagnosis)
Responsible Caregiver: Lisa Andersson
Continuity Caregiver Limit: 8 unique caregivers per 14-day period (default 10)
Monthly Visits: 60 (daily breakfast + dinner)
Rolling 14-day caregiver pool target: ≤8 people
Scenario Impact:
- Conservative: Same 4 caregivers stay with Anna all month ✓ Well under limit
- Balanced: 7 caregivers rotate (core team + backups) ✓ Meets limit
- Aggressive: Solver attempts to add 11th caregiver
❌ BLOCKED: "Anna already at caregiver limit (8/14 days)"
System reassigns so Anna sees 8 caregivers ✓ Stays below limit
If Lisa sick/vacation:
- Backup caregiver: Maria temporarily enters pool (still ≤8 caregivers)
- System maintains Anna's continuity by limiting any extras after Maria
Financial Impact of Allocation Hours:
Understanding the organizational structure that powers intelligent scheduling
CAIRE uses a hierarchical resource model: Organization → Service Area → Employee/Client. Settings and constraints cascade down this hierarchy, with more specific levels overriding general defaults. This enables flexible configuration while maintaining consistency.
Top-level defaults: Working time rules, break policies, optimization preferences, and integration settings. Apply to all service areas and employees unless overridden at lower levels.
Regional customization: Service areas can override organization defaults with area-specific rules. Supports hierarchical structure (Region → District → Neighborhood) for multi-level organizations.
Individual overrides: Employees and clients can have specific settings (working hours, break preferences, time windows) that override service area and organization defaults.
Hierarchical geographical organization for efficient resource allocation
Service areas support hierarchical organization (Region → District → Neighborhood). This enables flexible resource allocation, performance tracking at multiple levels, and efficient geographical optimization. Perfect for organizations of all sizes.
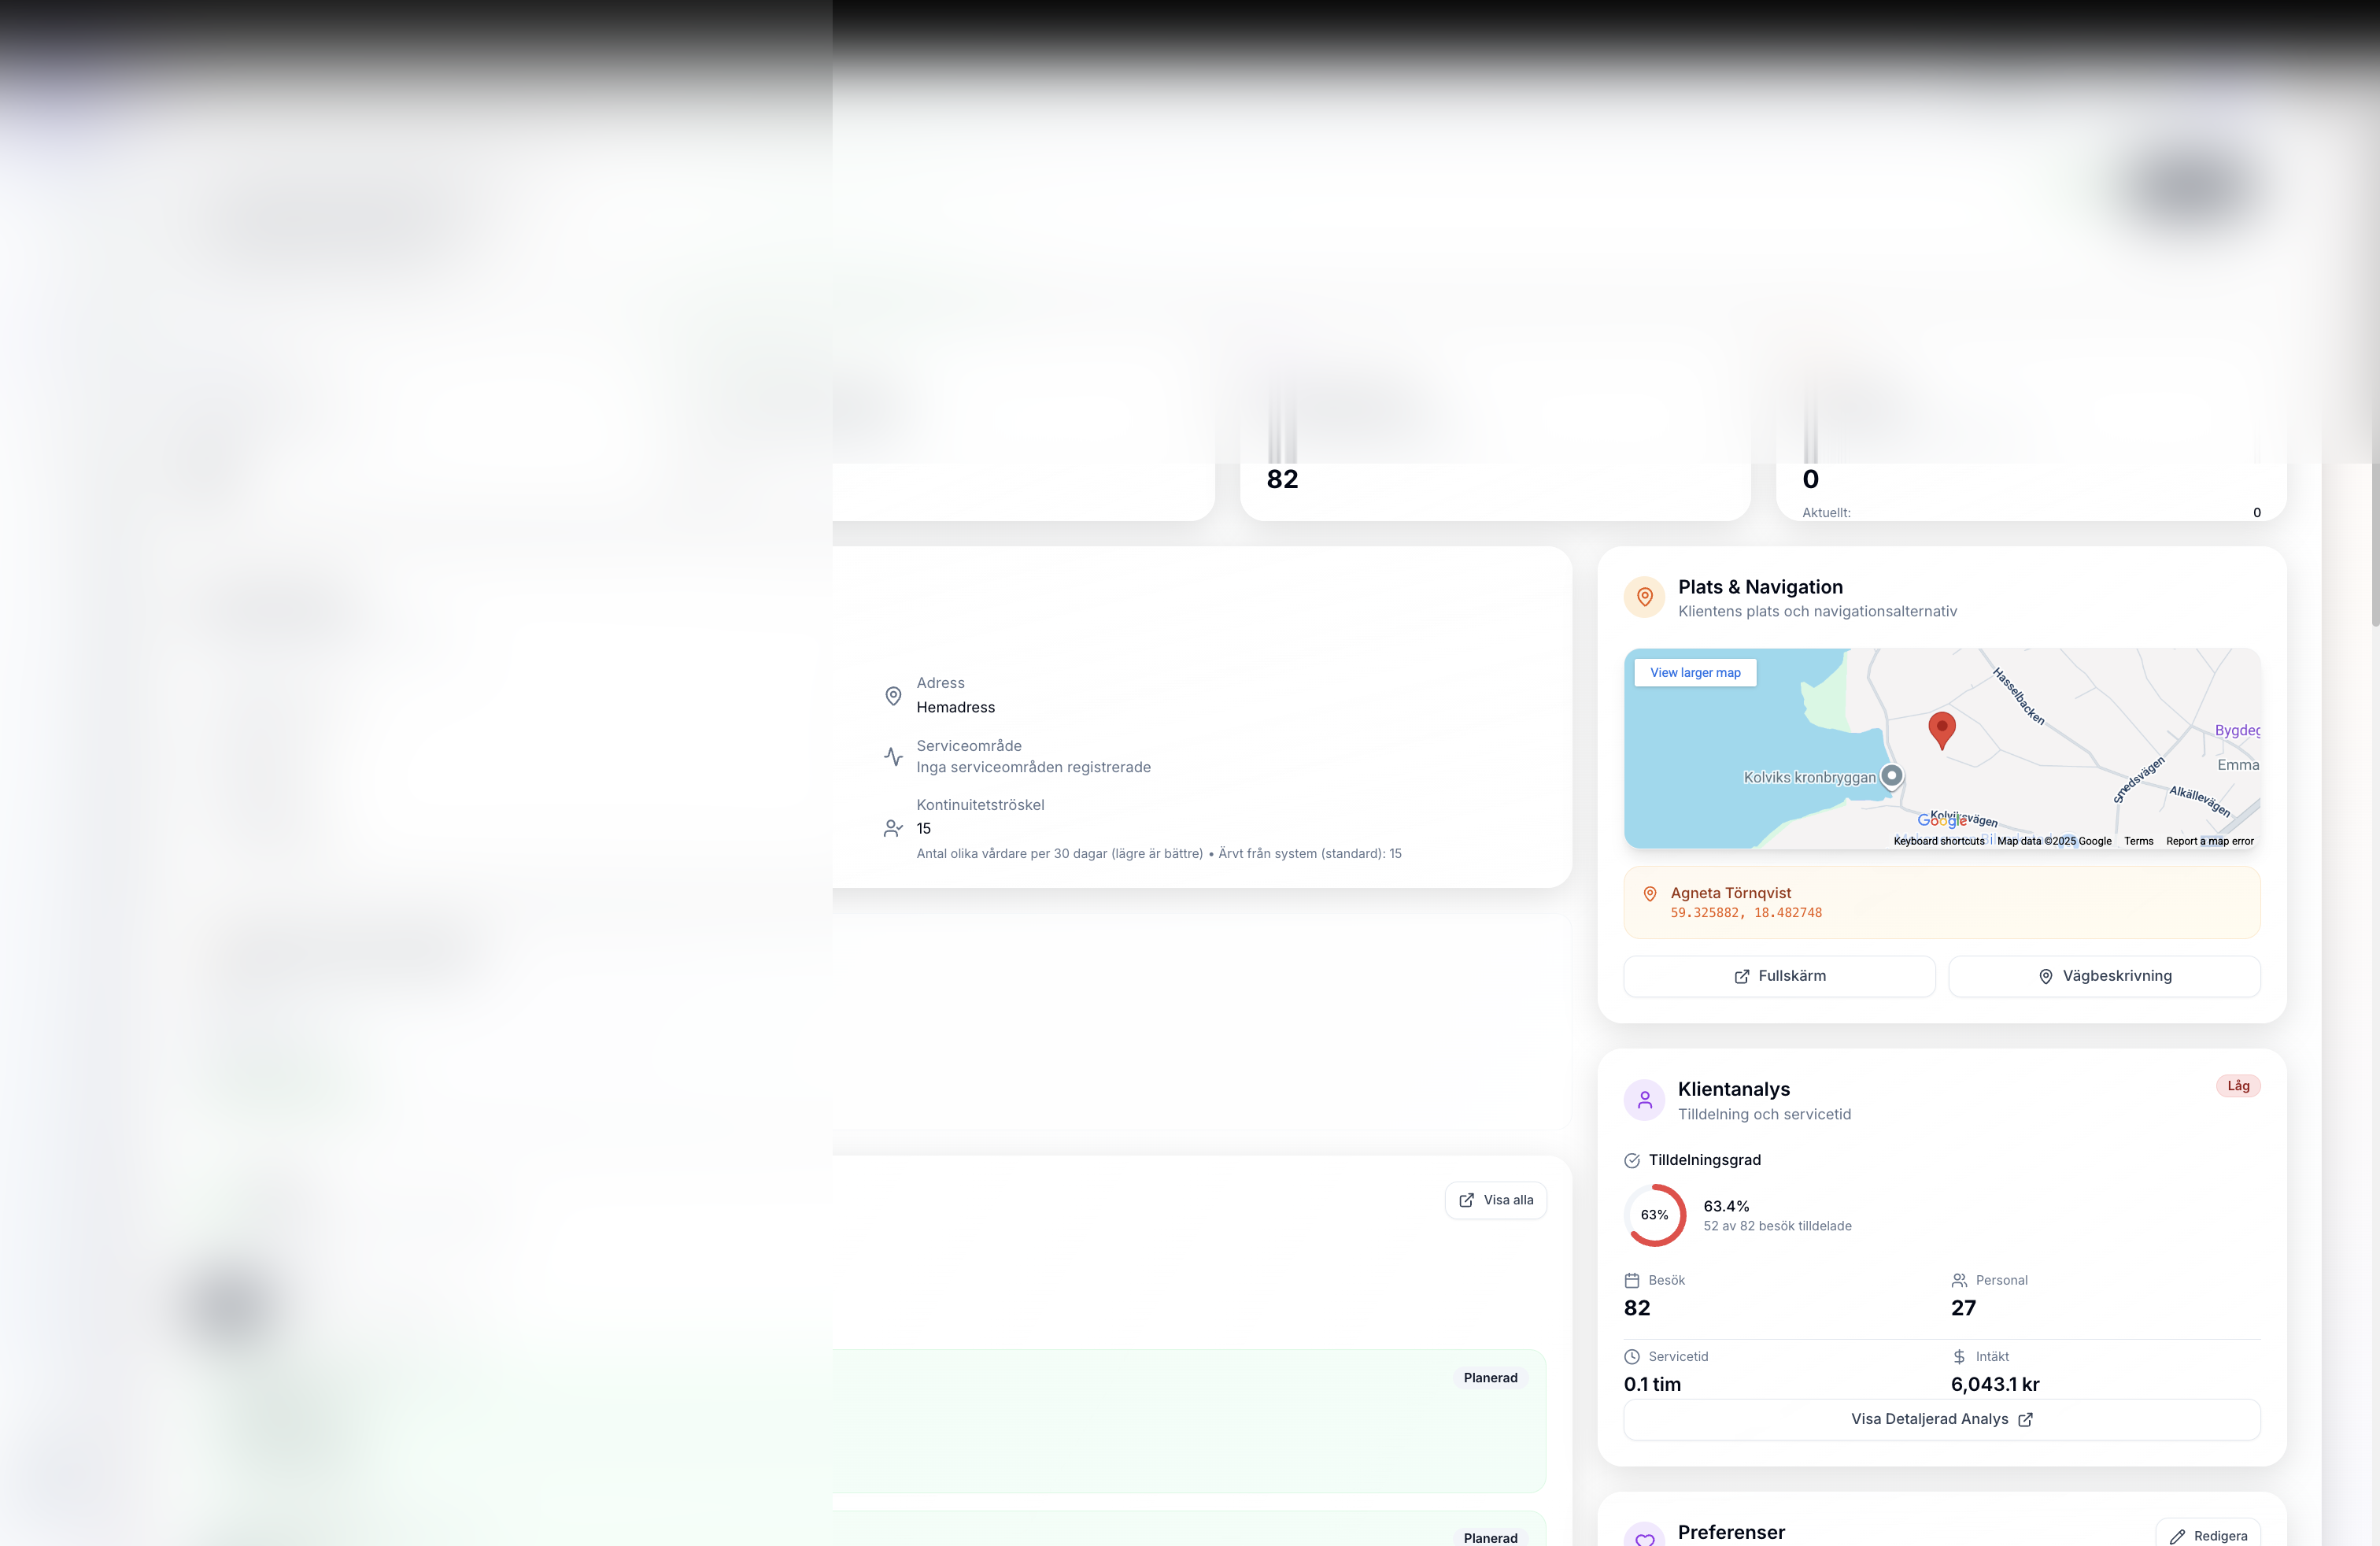
Define service area boundaries for accurate route optimization and resource allocation planning.
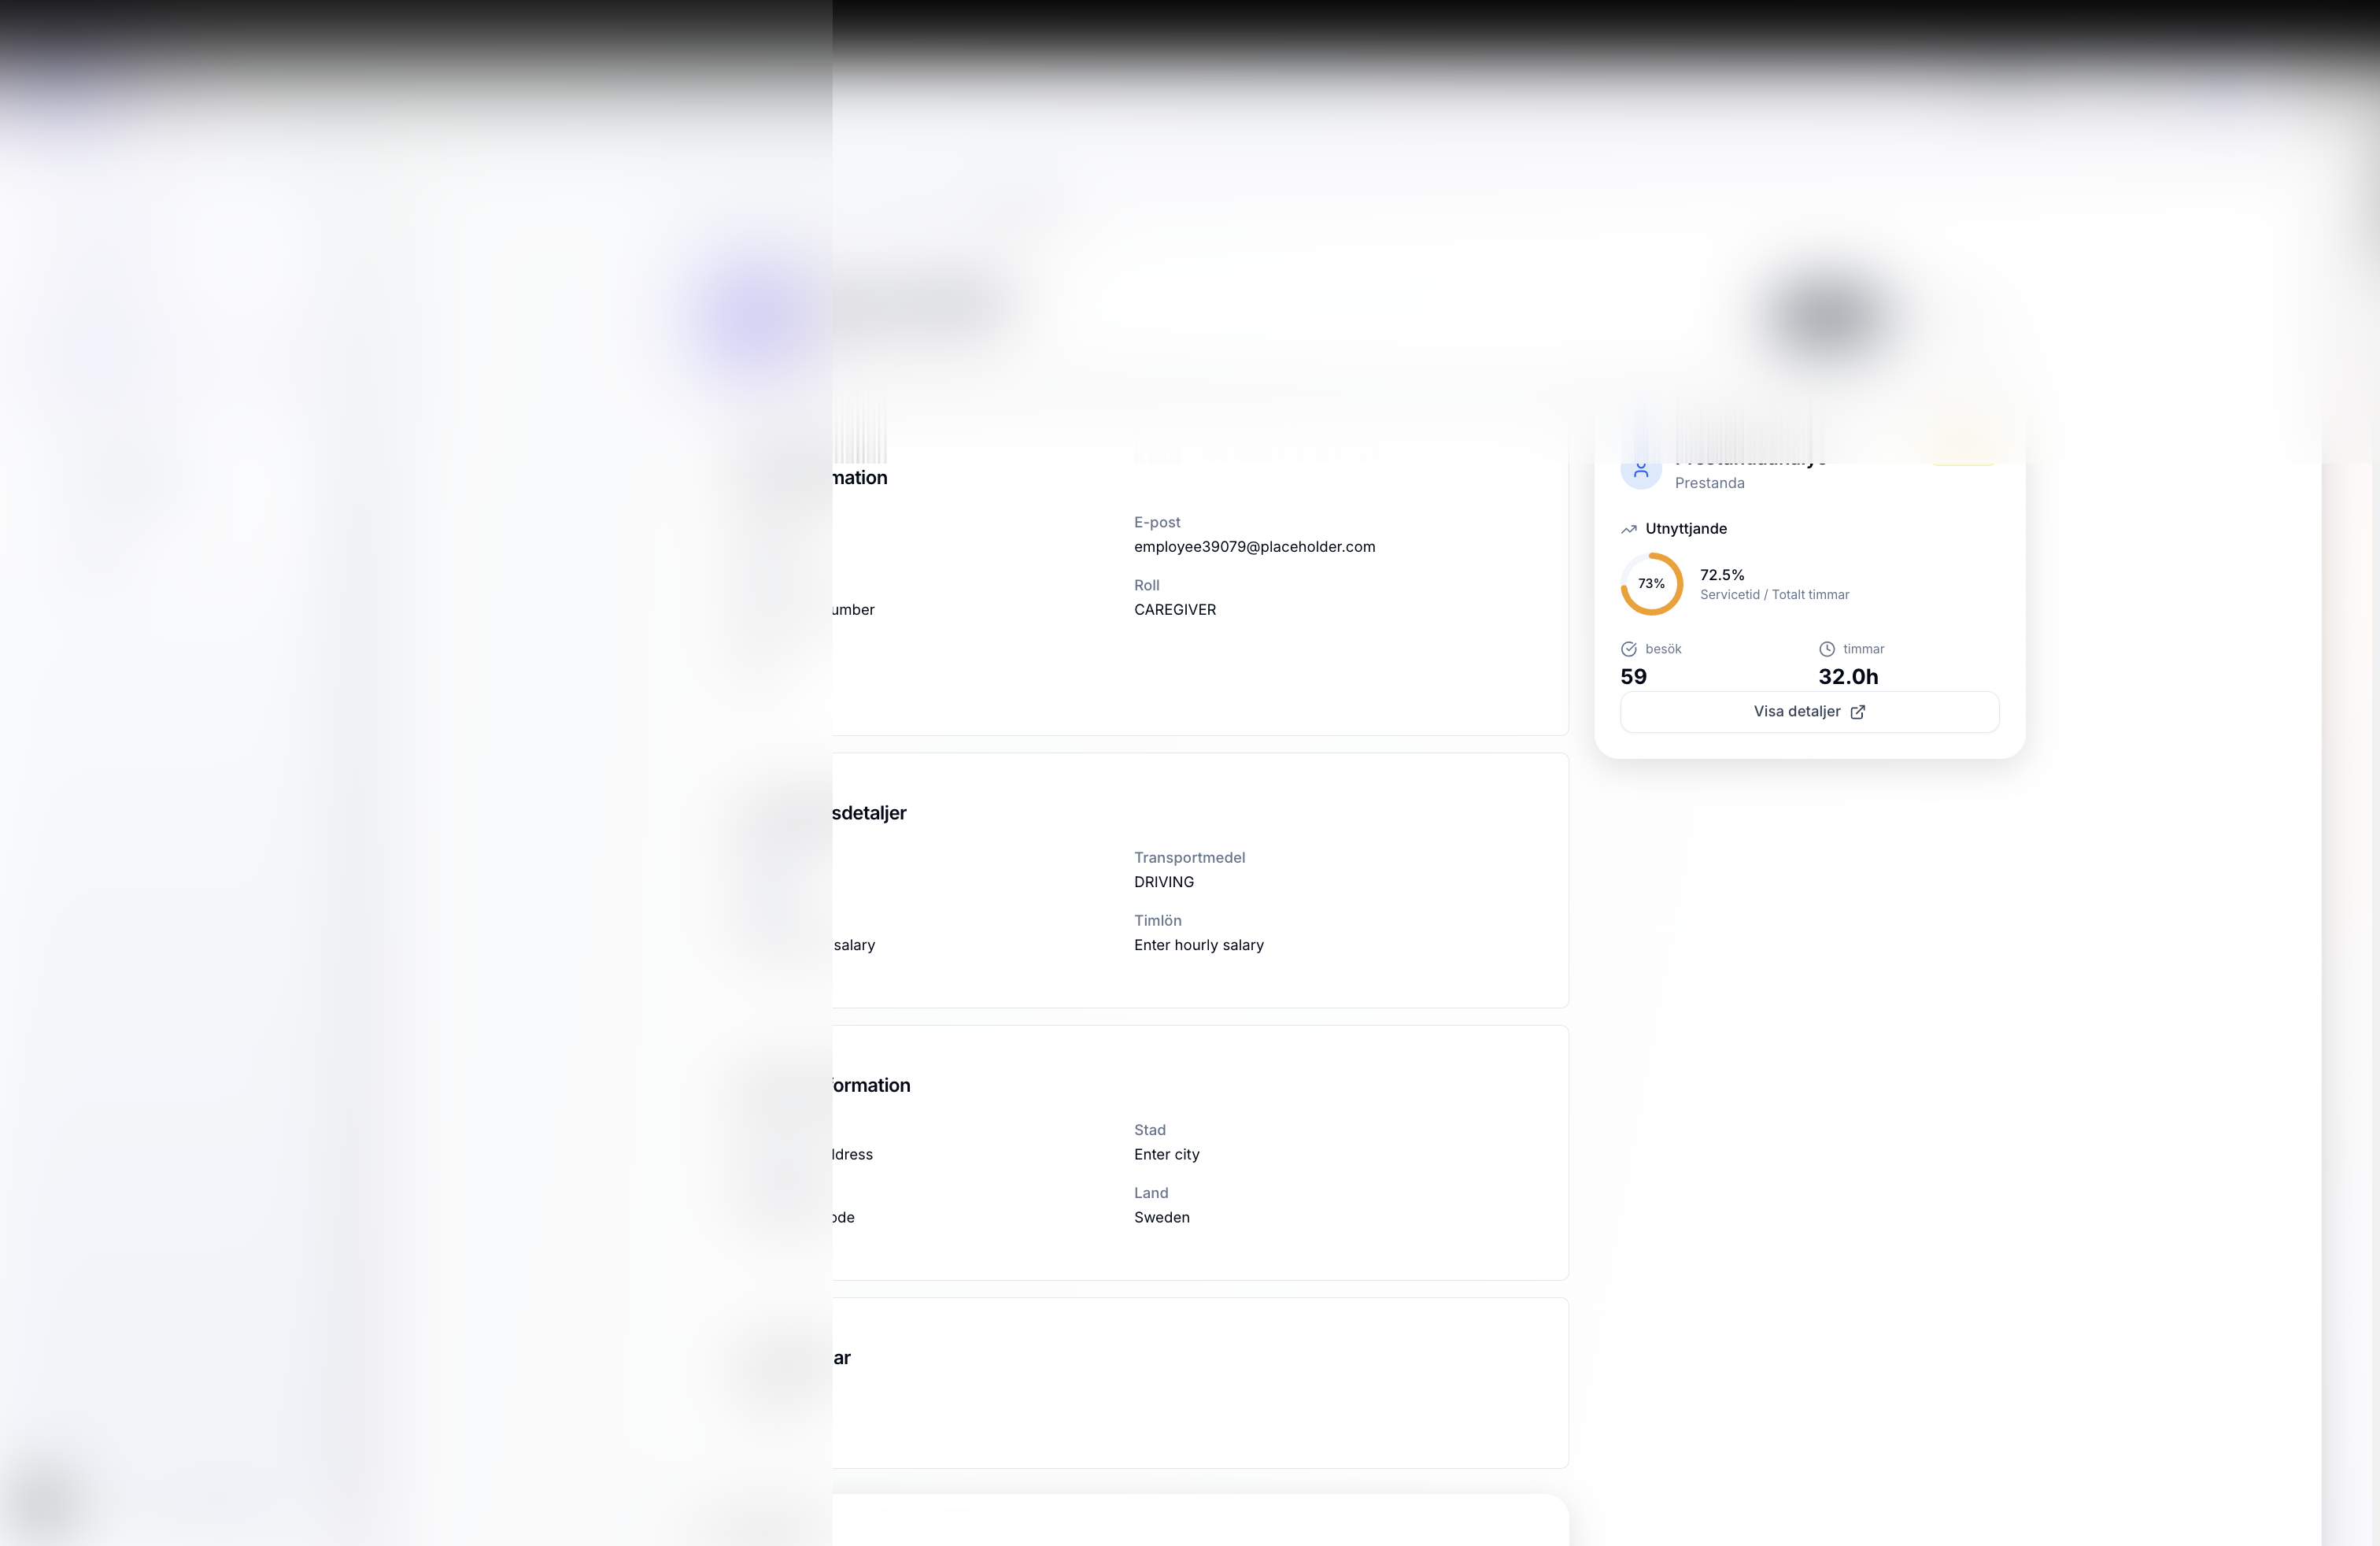
Assign employees to specific service areas. Track staff count and utilization per area for balanced workload.
Monitor visit metrics, assignment rates, time analytics, staff utilization, and financial performance for each service area.
Maintain hierarchical service area structure. Aggregate metrics roll up from child to parent areas for comprehensive reporting.
Track revenue, costs, and margins per service area. Identify profitable areas and improvement opportunities.
Service areas feed directly into AI optimization. Geographical constraints ensure realistic routing and travel time calculations.
Configure whether employees can be assigned visits across service area boundaries. Enable for flexibility, disable for strict geographic separation.
Disable specific service areas from import/optimization (e.g., administrative areas, analytics-only regions). Excluded areas maintain data but don't participate in scheduling.
Operational Settings per Service Area:
| Setting | Description | Default | Impact |
|---|---|---|---|
| Cross-Service Area Assignments | Allow employees to be assigned visits across different service areas | Disabled | When enabled: Staff can work in multiple areas (flexibility). When disabled: Staff only assigned to their home service area (geographic separation). |
| Include in Import | Include this service area in automatic imports from external systems | Enabled | When disabled: Area excluded from nightly imports and optimization (useful for admin areas, testing areas, or analytics-only regions). |
| Include in Optimization | Include this service area in AI optimization runs | Enabled | When disabled: Area maintains data but doesn't participate in scheduling (useful for inactive areas or regions under restructuring). |
| Default Hourly Rate | Service area-level hourly rate override | Organization default | Override for high-cost areas (urban vs rural compensation differences). |
Cross-Area Assignment Example:
Scenario: North and South Service Areas
Cross-Area Disabled (Default):
━━━━━━━━━━━━━━━━━━━━━━━━━━━━━━━━━━━━━━━━
North Area:
- Staff: 15 employees assigned to North
- Visits: 220 visits in North
- Assignment rule: North staff → North visits only
- Utilization: 80% (high)
South Area:
- Staff: 12 employees assigned to South
- Visits: 123 visits in South
- Assignment rule: South staff → South visits only
- Utilization: 40% (low)
Result: Geographic separation maintained, but imbalance exists
Cross-Area Enabled:
━━━━━━━━━━━━━━━━━━━━━━━━━━━━━━━━━━━━━━━━
Optimization runs across unified pool:
- All 27 staff can be assigned to any visit (North or South)
- System shifts 2 South staff to North high-demand area
- North: 17 staff, 220 visits = 94% utilization (better!)
- South: 10 staff, 123 visits = 70% utilization (better!)
Trade-off:
- Better utilization balance
- Slightly longer travel for shifted staff
- Less familiar with cross-area customers initially
Use when: Staff shortage in one area, geographic imbalance, flexibility needed
Import Filtering Example:
Organization: Regional Health Services
Service Areas:
1. North Operations (Include in Import: ✓, Include in Optimization: ✓)
2. South Operations (Include in Import: ✓, Include in Optimization: ✓)
3. Central Admin (Include in Import: ✗, Include in Optimization: ✗)
4. Analytics Test Area (Include in Import: ✗, Include in Optimization: ✗)
Nightly Import Results:
- North: 220 visits imported and optimized ✓
- South: 123 visits imported and optimized ✓
- Central Admin: Skipped (admin area only, no field operations)
- Analytics Test: Skipped (testing area, not production)
Benefits:
- Clean optimization (only operational areas)
- No need to manually exclude admin areas
- Analytics areas can exist for reporting without affecting schedules
- Faster optimization (fewer resources to process)
Configure buffer times to ensure employees can travel to/from office at shift start/end
All employee routes start and end at office. Travel buffers ensure the first visit starts after travel time from office, and the last visit completes with enough time to return to office before shift ends. Prevents unrealistic schedules and ensures employees can complete their shifts on time.
Setting: Minutes after shift start before first visit can begin (default: 5 minutes)
Purpose: Allow time to travel from office to first customer location
Example: Shift starts 07:00, buffer is 5 min → First visit earliest start: 07:05
Why Needed: Employees need time to leave office, get to vehicle, drive to first customer. Prevents scheduling visit at exact shift start time (07:00) when employee hasn't left office yet.
Setting: Minutes before shift end to allow return to office (default: 5 minutes)
Purpose: Ensure last visit completes with time to return to office before shift ends
Example: Shift ends 16:00, buffer is 5 min → Last visit must complete by 15:55
Why Needed: After last customer visit, employee must drive back to office. Buffer ensures they return before shift officially ends.
Example 1: Day Shift with 5-Minute Buffers
Scheduled Shift: 07:00-16:00 (9 hours)
First Visit Delay: 5 minutes
Last Visit Buffer: 5 minutes
Effective Schedule Window: 07:05-15:55 (8 hours 50 minutes)
Employee Lisa's Day:
07:00 Arrive at office, prepare for shift
07:00-07:12 🚗 Travel from office to first customer (12 min)
07:12-07:52 🏠 First visit: Anna (40 min)
...middle visits...
14:25-14:55 🏠 Last visit: Erik (30 min)
14:55-15:10 🚗 Travel from Erik back to office (15 min)
15:10 Arrive at office (50 min before shift end)
15:10-16:00 Buffer time: Documentation, vehicle return, end-of-day tasks
Result: Lisa completes all visits and returns to office with time to spare ✓
Example 2: Evening Shift with 5-Minute Buffers
Scheduled Shift: 16:00-22:00 (6 hours)
First Visit Delay: 5 minutes
Last Visit Buffer: 5 minutes
Effective Schedule Window: 16:05-21:55 (5 hours 50 minutes)
Employee Johan's Evening:
16:00 Arrive at office, prepare
16:00-16:08 🚗 Travel to first customer (8 min)
16:08-16:38 🏠 First visit: Dinner preparation (30 min)
...evening visits...
21:25-21:55 🏠 Last visit: Bedtime care (30 min)
21:55-22:05 🚗 Travel back to office (10 min)
22:05 Arrive at office (5 min after official shift end)
Issue: ⚠️ Overtime by 5 minutes (not ideal but minor)
Recommendation: Increase last visit buffer to 10-15 min for evening shifts
Buffer Configuration Recommendations:
| Area Type | First Visit Delay | Last Visit Buffer | Reasoning |
|---|---|---|---|
| Urban (Dense) | 5 minutes | 5 minutes | Short distances, predictable traffic |
| Suburban | 10 minutes | 10 minutes | Moderate distances, variable traffic |
| Rural (Spread) | 15 minutes | 15 minutes | Long distances, unpredictable travel |
| Morning Rush | 10 minutes | 5 minutes | Traffic delays at shift start |
| Evening Shift | 5 minutes | 10 minutes | Return traffic at shift end |
Travel buffers can be configured at multiple levels:
Configuration Example:
Organization Default: 5 min first, 5 min last
Service Area North (Urban): Uses organization default (5 min)
Service Area South (Rural): Override to 15 min first, 15 min last
Result:
- North employees: 07:05 first visit, 15:55 last visit (9h shift)
- South employees: 07:15 first visit, 15:45 last visit (9h shift)
- South gets 20 min less effective time but realistic for geography
Impact on Capacity:
Fine-tune service area behavior for complex organizational structures
Setting: Enable or disable cross-area employee assignments
When Enabled: Employees can be assigned visits in any service area, allowing optimization across geographic boundaries
When Disabled: Employees only assigned to visits in their home service area, maintaining strict geographic separation
Use Case Enabled: Staff shortage in one area, geographic imbalance, maximize flexibility
Use Case Disabled: Clear geographic responsibilities, staff familiarity with area, customer relationship continuity
Include in Import: Control whether service area participates in nightly data imports
Include in Optimization: Control whether service area participates in AI optimization
Use Case Exclude: Administrative areas, analytics-only regions, testing environments, inactive service areas under restructuring
Benefit: Cleaner data, faster optimization, avoid processing non-operational areas
Scenario 1: Multi-Region Organization with Admin Area
Organization: Regional Health Services
Service Areas:
1. North Operations
- Include in Import: ✓
- Include in Optimization: ✓
- Cross-Area: ✗ (stays in North)
2. South Operations
- Include in Import: ✓
- Include in Optimization: ✓
- Cross-Area: ✗ (stays in South)
3. Central Administration
- Include in Import: ✗ (no field operations)
- Include in Optimization: ✗ (admin staff only)
- Purpose: Track admin staff for reporting, but don't schedule visits
4. Analytics Test Area
- Include in Import: ✗ (not production)
- Include in Optimization: ✗ (testing environment)
- Purpose: Test scenarios without affecting production schedules
Result:
- Only North and South participate in daily scheduling
- Admin and Analytics areas maintain data for reporting
- Clean, focused optimization on operational areas only
Scenario 2: Emergency Cross-Area Coverage
Situation: North area has multiple staff sick
Temporary Configuration Change:
Service Area North:
- Cross-Area Assignments: Enabled (was disabled)
- Duration: 3 days (emergency period)
Service Area South:
- Cross-Area Assignments: Enabled (allow staff to help North)
Result:
- 2 South employees temporarily assigned to North high-priority visits
- Geographic flexibility during crisis
- Return to disabled after emergency resolved
- Total time: 20 minutes configuration change vs hours of manual coordination
Scenario 3: Seasonal Area Deactivation
Situation: Summer vacation period - low demand in vacation region
Service Area Beach District:
- Include in Import: ✓ (still import to track changes)
- Include in Optimization: ✗ (don't optimize - area closed for summer)
- Duration: June-August (3 months)
Result:
- Data continues importing (so no data loss)
- No optimization runs (saves processing time)
- Staff reallocated to other active areas
- Re-enable optimization in September when area reopens
Benefits:
- Don't lose data during inactive period
- No wasted optimization cycles
- Easy reactivation when season changes
Resources work together to drive intelligent scheduling
All resource data stored in one place. No duplicates, consistent information across the platform, and single source of truth for operations.
Changes to resources immediately impact scheduling. Update an employee's availability and the system instantly recalculates affected schedules.
Resource constraints automatically feed into AI optimization. Skills, availability, and preferences become scheduling rules without manual configuration.
Complete audit trail of resource changes. Track who made changes, when, and why. Essential for compliance and operational transparency.
CAIRE follows enterprise-grade data management principles
Each organization's data is kept separate. You own your information – CAIRE only processes it on your behalf with bank-level security.
All input data is validated before saving. Prevents errors and ensures data integrity throughout the system.
Handle multiple users updating resources simultaneously. Transaction management ensures data consistency and prevents conflicts.
Comprehensive logging of all changes. Track who, what, when, and why for complete operational transparency.
Efficient caching, pagination, and query optimization ensure fast loading even with thousands of resources.
Role-based access control ensures only authorized personnel can view or modify sensitive resource data.
Flexible calculation methods to match your organization's compensation policies
Different organizations have different payment policies for hourly employees. Caire supports four payment models (A, B, C, D) combined with PAID or UNPAID break policies to accurately calculate staff costs for scheduling optimization and financial forecasting.
Payment: Employees paid only for direct customer service time (visits).
Includes: Visit time only
Excludes: Travel, waiting time
Breaks: PAID = included, UNPAID = excluded
Use Case: Pay-per-service organizations that compensate only for direct care delivery.
Payment: Employees paid for service time plus travel time.
Includes: Visit time + travel time
Excludes: Waiting time
Breaks: PAID = included, UNPAID = excluded
Use Case: Organizations that compensate employees for both service delivery and route travel.
Payment: From shift start until last visit completion and return to office.
Includes: Service + travel + waiting time
Excludes: Time after returning to office
Breaks: PAID = included, UNPAID = subtracted
Use Case: Swedish standard model. Pay from work start to work end.
Payment: Employees paid for entire scheduled shift (e.g., 07:00-16:00 = 9 hours).
Includes: Full shift time as imported from schedule system
Excludes: Nothing (fixed shift payment)
Breaks: PAID = included, UNPAID = subtracted
Use Case: Organizations with fixed shift contracts where payment is based on scheduled time, not activity.
PAID Breaks (Betald rast): Break time is included in employee compensation. Costs include break time, and breaks count toward paid hours.
UNPAID Breaks (Obetald rast - Swedish Standard): Break time is NOT included in employee compensation. Costs exclude break time. Standard Swedish practice where lunch breaks are unpaid.
Note: Breaks are ALWAYS excluded from available service time calculation (capacity planning), regardless of payment policy. This ensures accurate capacity forecasting.
Scenario: Employee works 8-hour shift with the following breakdown:
| Model | PAID Breaks | UNPAID Breaks |
|---|---|---|
| Model A Service Only |
6.5h × 185 = 1,203 SEK (service + breaks) |
6.0h × 185 = 1,110 SEK (service only) |
| Model B Service + Travel |
7.5h × 185 = 1,388 SEK (service + travel + breaks) |
7.0h × 185 = 1,295 SEK (service + travel) |
| Model C Shift to Last Visit |
8.0h × 185 = 1,480 SEK (full working time) |
7.5h × 185 = 1,388 SEK (working time - breaks) |
| Model D Full Shift |
8.0h × 185 = 1,480 SEK (scheduled shift) |
7.5h × 185 = 1,388 SEK (shift - breaks) |
Note: Fixed employees (full-time, part-time contracts) always use Model D logic regardless of organizational setting, as they are paid for scheduled shifts.
Why Payment Models Matter for Scheduling:
Configuration: Payment model and break policy are configured at organization level. Changes apply to all future optimizations immediately. Historical schedules maintain original cost calculations for audit trail.
Powerful capabilities for complex scheduling scenarios
Resources work with scheduling scenarios. Create different optimization approaches (Conservative, Balanced, Aggressive) and test how they affect resource utilization without changing your base configuration.
Temporarily exclude specific clients from scenario optimizations without deleting them. Useful for testing "what if" scenarios or handling temporary service suspensions while preserving historical data.
Filter employees and clients by service area during optimization. Include only resources relevant to specific geographical regions. Can be disabled to allow cross-area optimization if needed.
Set client-specific priority levels that influence scheduling order. High-priority clients can be scheduled first or given preferred time slots while maintaining overall optimization.
Cap the caregiver pool per client (e.g., ≤10 unique caregivers every 14 days). The solver monitors the rolling count and keeps assignments within that guardrail.
Identify and recapture unused time slots per client. Track unutilized hours and convert them into billable service time through intelligent optimization.
Settings cascade hierarchically: Employee-specific → Service Area → Organization → System defaults. More specific settings always take precedence.
Every resource level tracks performance metrics. Monitor utilization, costs, and efficiency at organization, service area, and individual levels.
Control which resources participate in schedule optimization
When running schedule optimization, you can choose to filter by service area or include all resources. Filtering ensures only relevant employees and clients are considered for a specific geographical region, reducing complexity and improving optimization speed. Disabling filtering allows cross-area assignments when needed for coverage or flexibility.
Filter employees by assigned service areas. Only include staff who work in the target region, reducing optimization complexity and ensuring realistic assignments.
Filter clients by service area. Include only clients in specific regions for targeted optimization. Maintains geographical coherence and realistic travel times.
Disable filtering to allow employees to work across service areas when needed. Useful for sick leave coverage, capacity constraints, or flexible resource sharing.
Further filter employees by schedule availability. Include only staff with schedules on optimization dates. Ensures assignments are realistic and feasible.
Test different strategies without affecting your baseline data
Scenarios allow you to test different optimization approaches (break policies, visit flexibility, resource constraints) without modifying your base resource configuration. Each scenario creates a temporary clone of your schedule with overrides applied, preserving the original data.
Scenarios automatically clone the baseline schedule. Original data remains untouched while you test different optimization parameters.
Test different break policies (timing, duration, paid/unpaid) per scenario. See how break flexibility affects overall efficiency without changing employee contracts.
Adjust visit time windows and service duration per scenario. Test how more or less flexibility impacts optimization results and client satisfaction.
Disable specific clients or employees in scenarios. Test capacity without certain resources or simulate "what if" scenarios for strategic planning.
Run multiple scenarios in parallel. Compare metrics (efficiency, travel time, costs) to find optimal balance for your organization.
Review scenario results before applying changes. Nothing affects your live operations until you explicitly approve and export the optimized schedule.
Seamlessly integrate with your existing systems
Import employees, clients, and service areas from CSV files exported from Carefox, eCare, Excel, or other systems. Bulk upload with validation and error reporting.
Direct integration with Carefox, Welfare/eCare, and other home care systems. Automatic sync keeps resource data current without manual effort.
Export resource data and reports in multiple formats (CSV, Excel, PDF). Share with management or integrate with other business systems.
Head to scheduling and analytics to see how these resources are planned and measured across every scenario.